


OVERVIEW
As part of a cross-functional team, I worked on redesigningthe service requests portal used by Wellington Electricity. These portals had become outdated and posed cybersecurity risks due to unsupported hosting platforms.
Our goal was to upgrade the portal by identifying user needs, mapping out current processes, and designing an improved interface. Through user research, stakeholder engagement, and iterative prototyping in Figma, we aimed to deliver a secure, intuitive experience that supports core operational workflows while minimising ambiguity for developers during implementation.
ABOUT THE PRODUCT
Wellington Electricity is a Power Distribution Company. Wellington Electricity has two SAP portals. The SAP Service Requests (SR) portal and Plant Maintenance Portal. The SR portal supports 4 main business processes including New Connections, Decommissions, Upgrades/Downgrades and Temporary Disconnections.
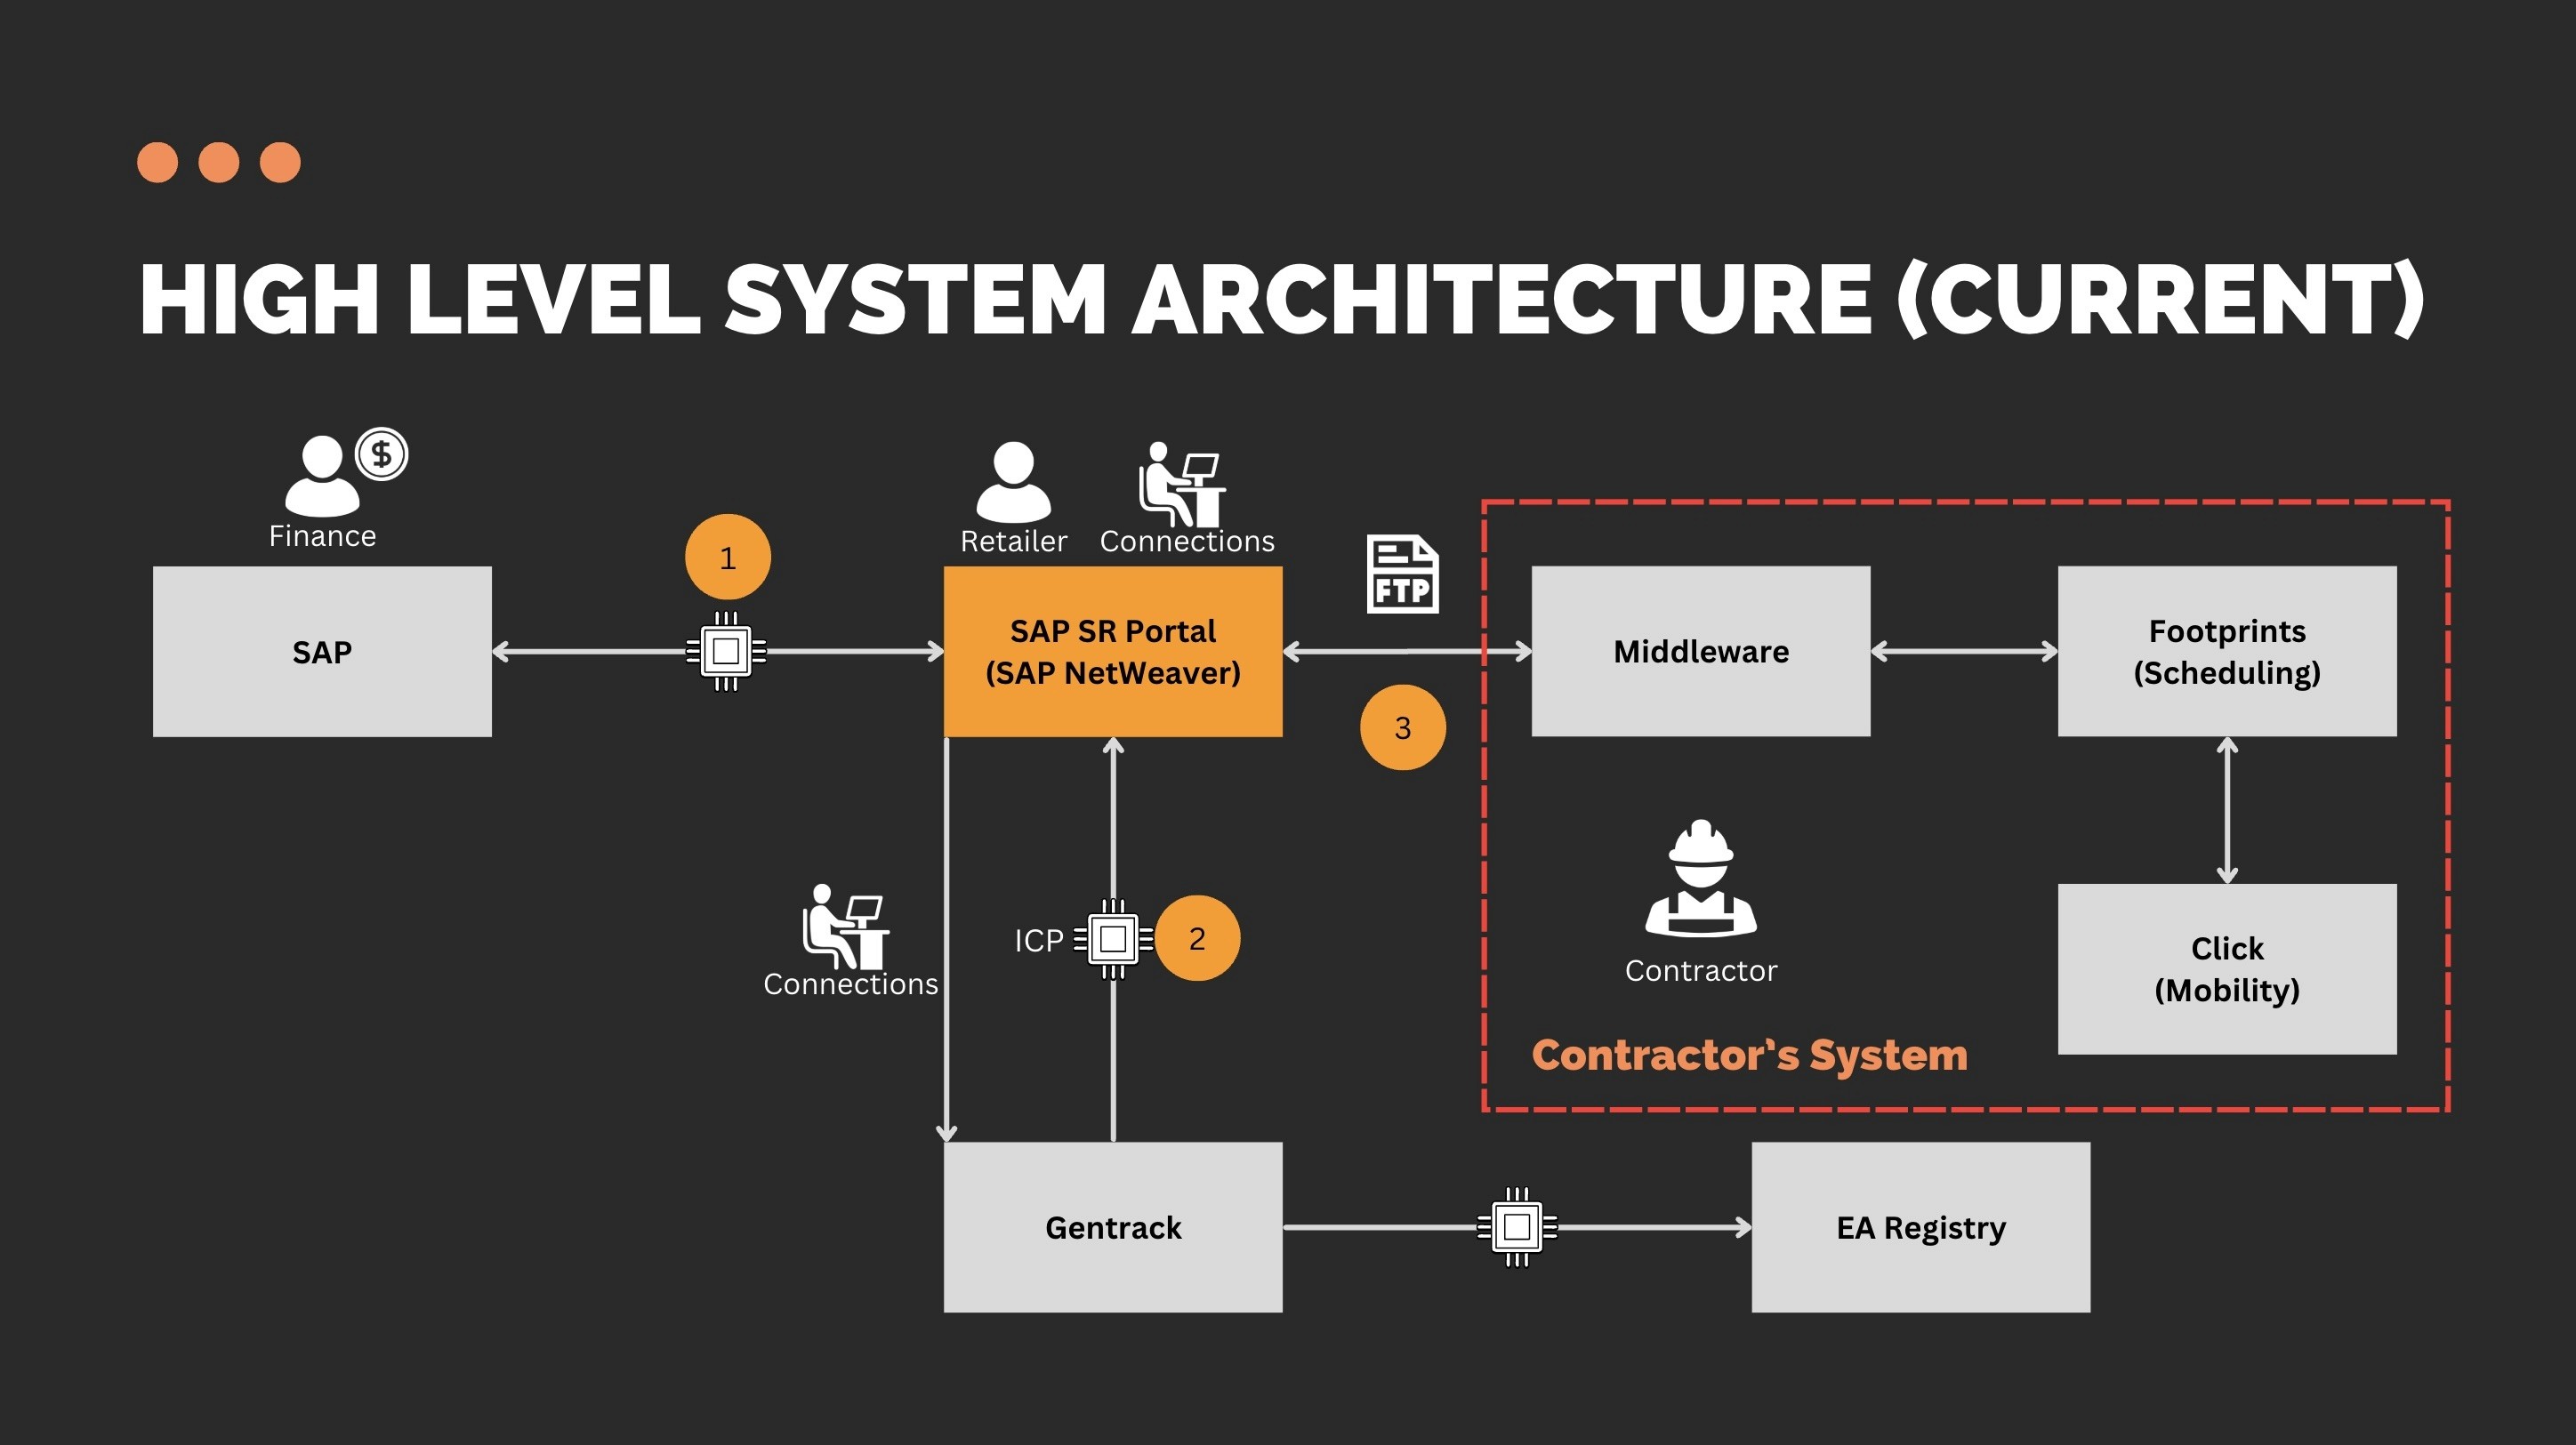
CURRENT SYSTEM ARCHITECTURE
The current service request process begins when a retailer submits a new request, typically for a new electricity connection. If required, an ICP (Installation Control Point) is generated in Gentrack. The ICP number is then manually entered into the portal. Once the request is logged, Wellington Electricity (WE) sends the job details to the Contractor. Upon receiving the request, the contractor becomes responsible for scheduling and completing the work. After the job is carried out, WE verifies the job data and updates Gentrack as needed.
If the job meets all requirements, WE marks the request as complete in the portal. This final step triggers a transaction in SAP, officially closing out the process.
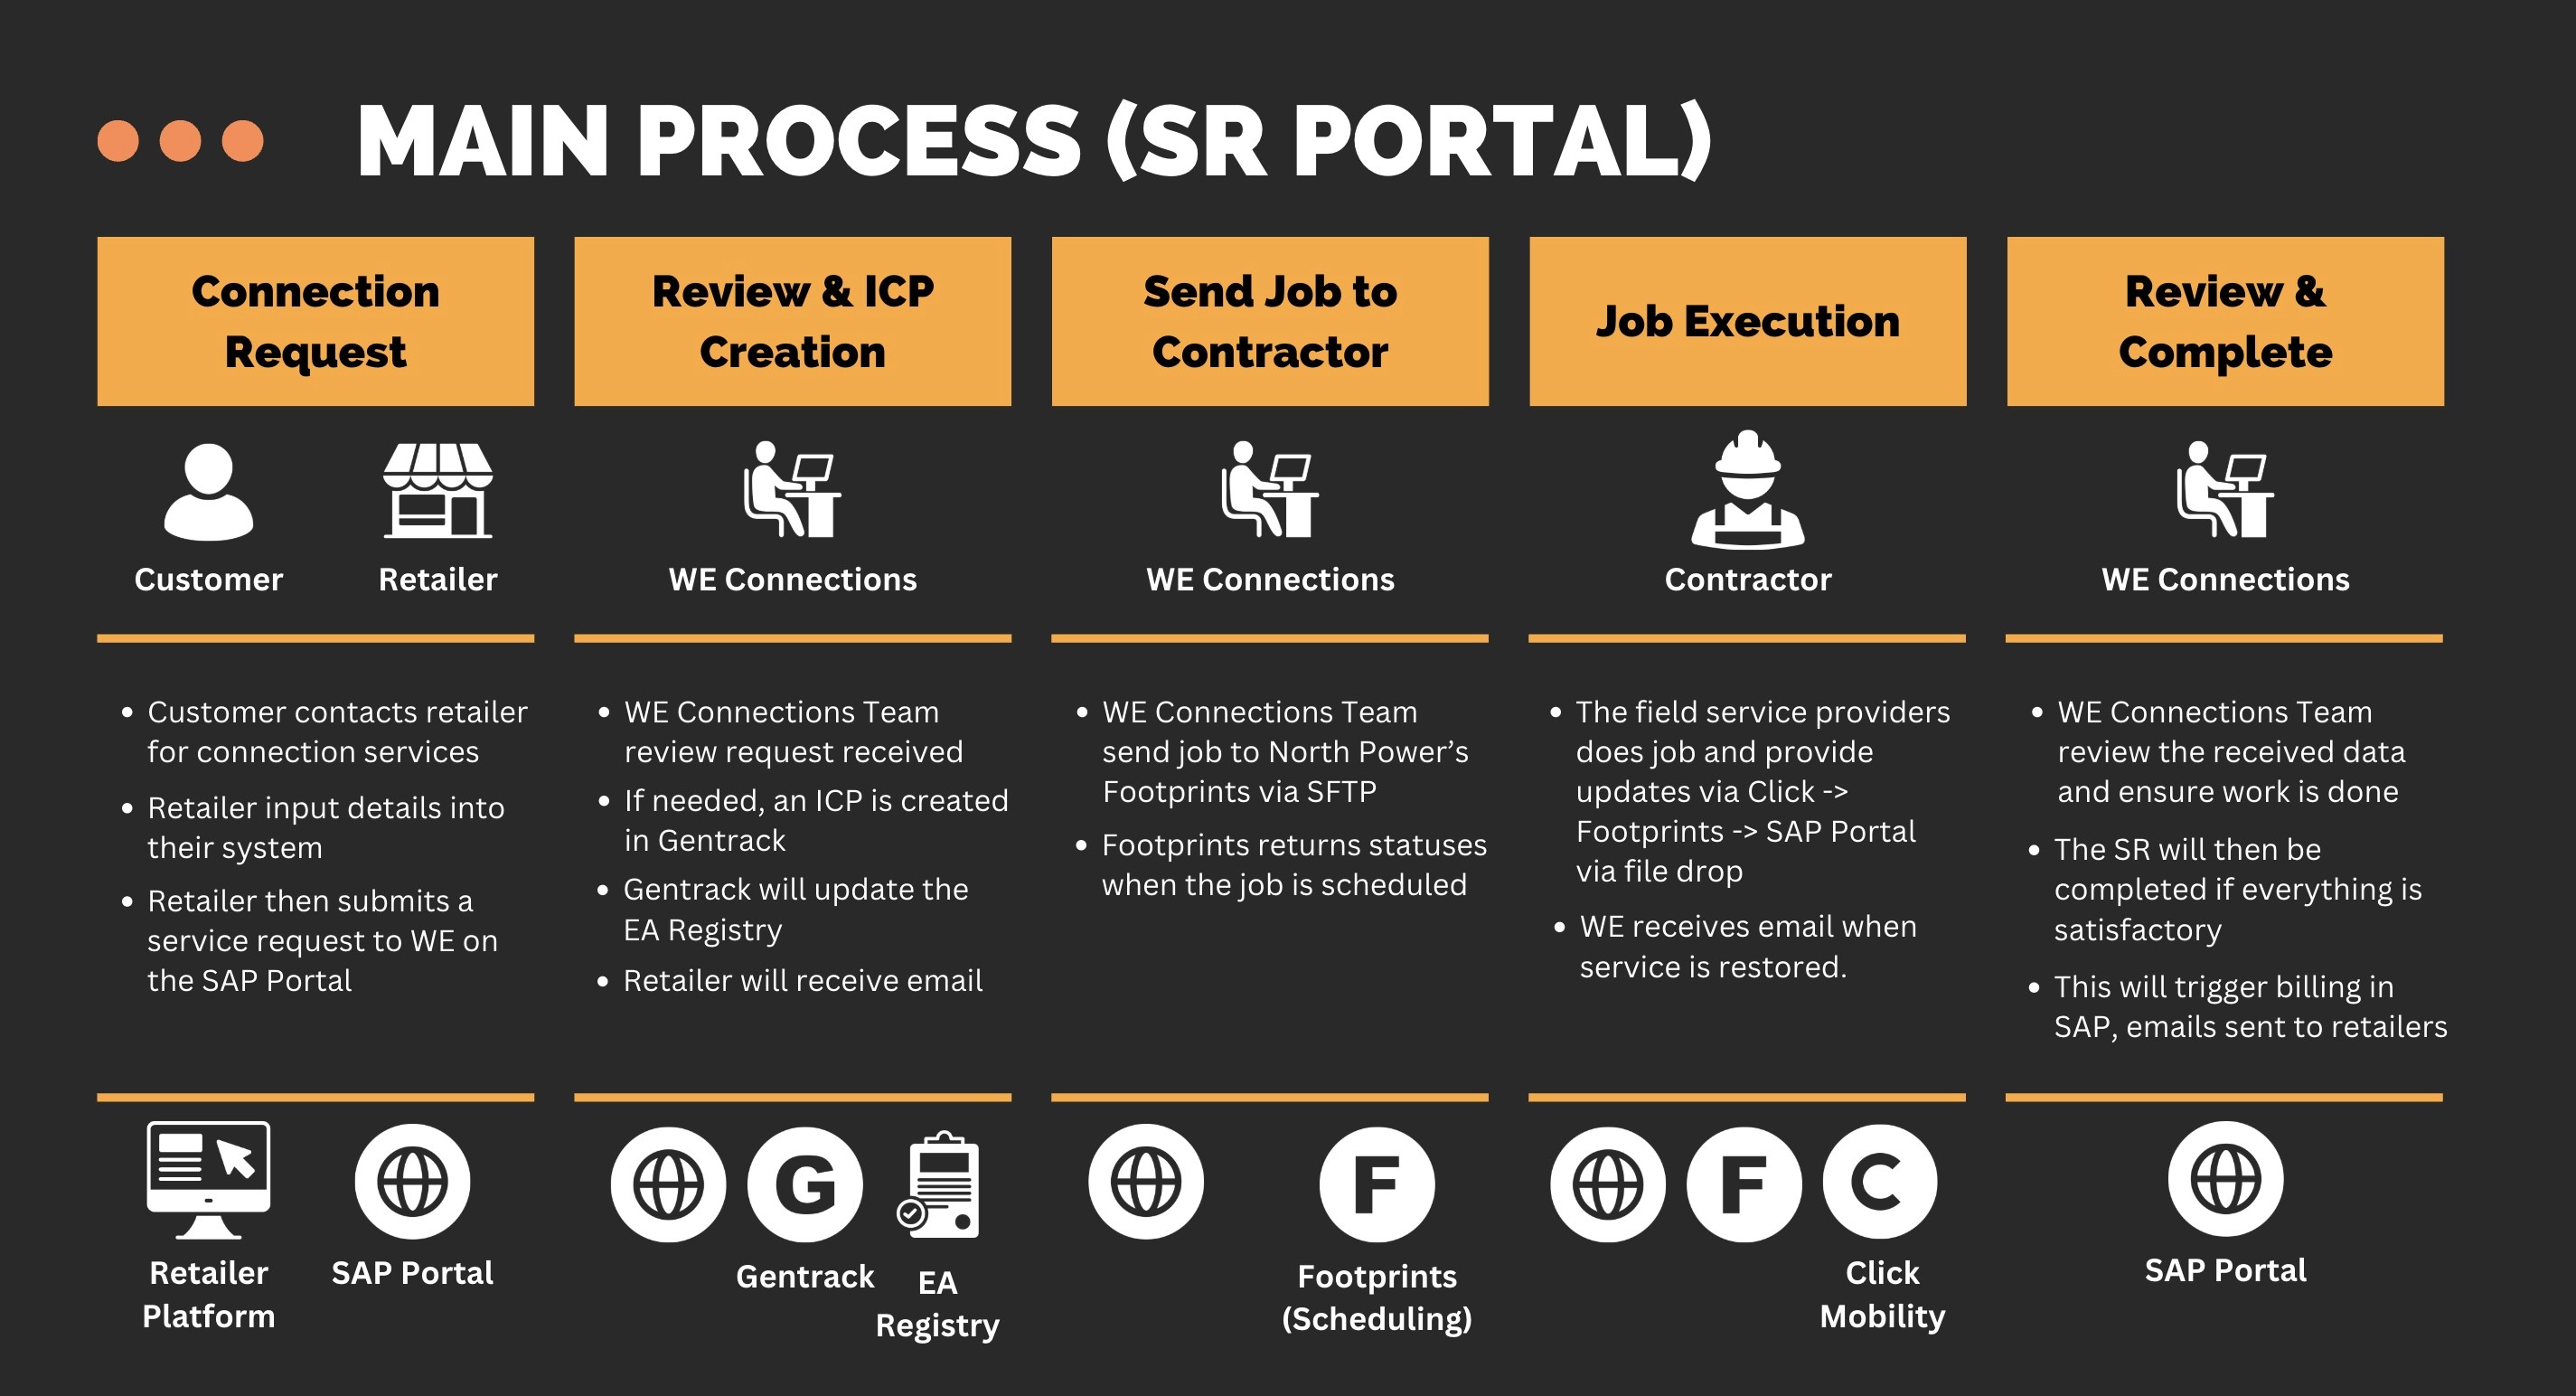
PROCESS MAP
To gain a deeper understanding of the current process flow, together with my team lead I interviewed several key users of the portal. During these sessions, we asked team members to walk us through the processing of various Service Requests currently in their queue. By using real-life case scenarios, we were able to see the broader context and identify the unique life cycles of different types of Service Requests within the existing system. Insights gathered from these interviews were synthesised into a visual process map that helped us align with stakeholders and understand the end-to-end workflow.

UNDERSTANDING THE PROBLEM SPACE
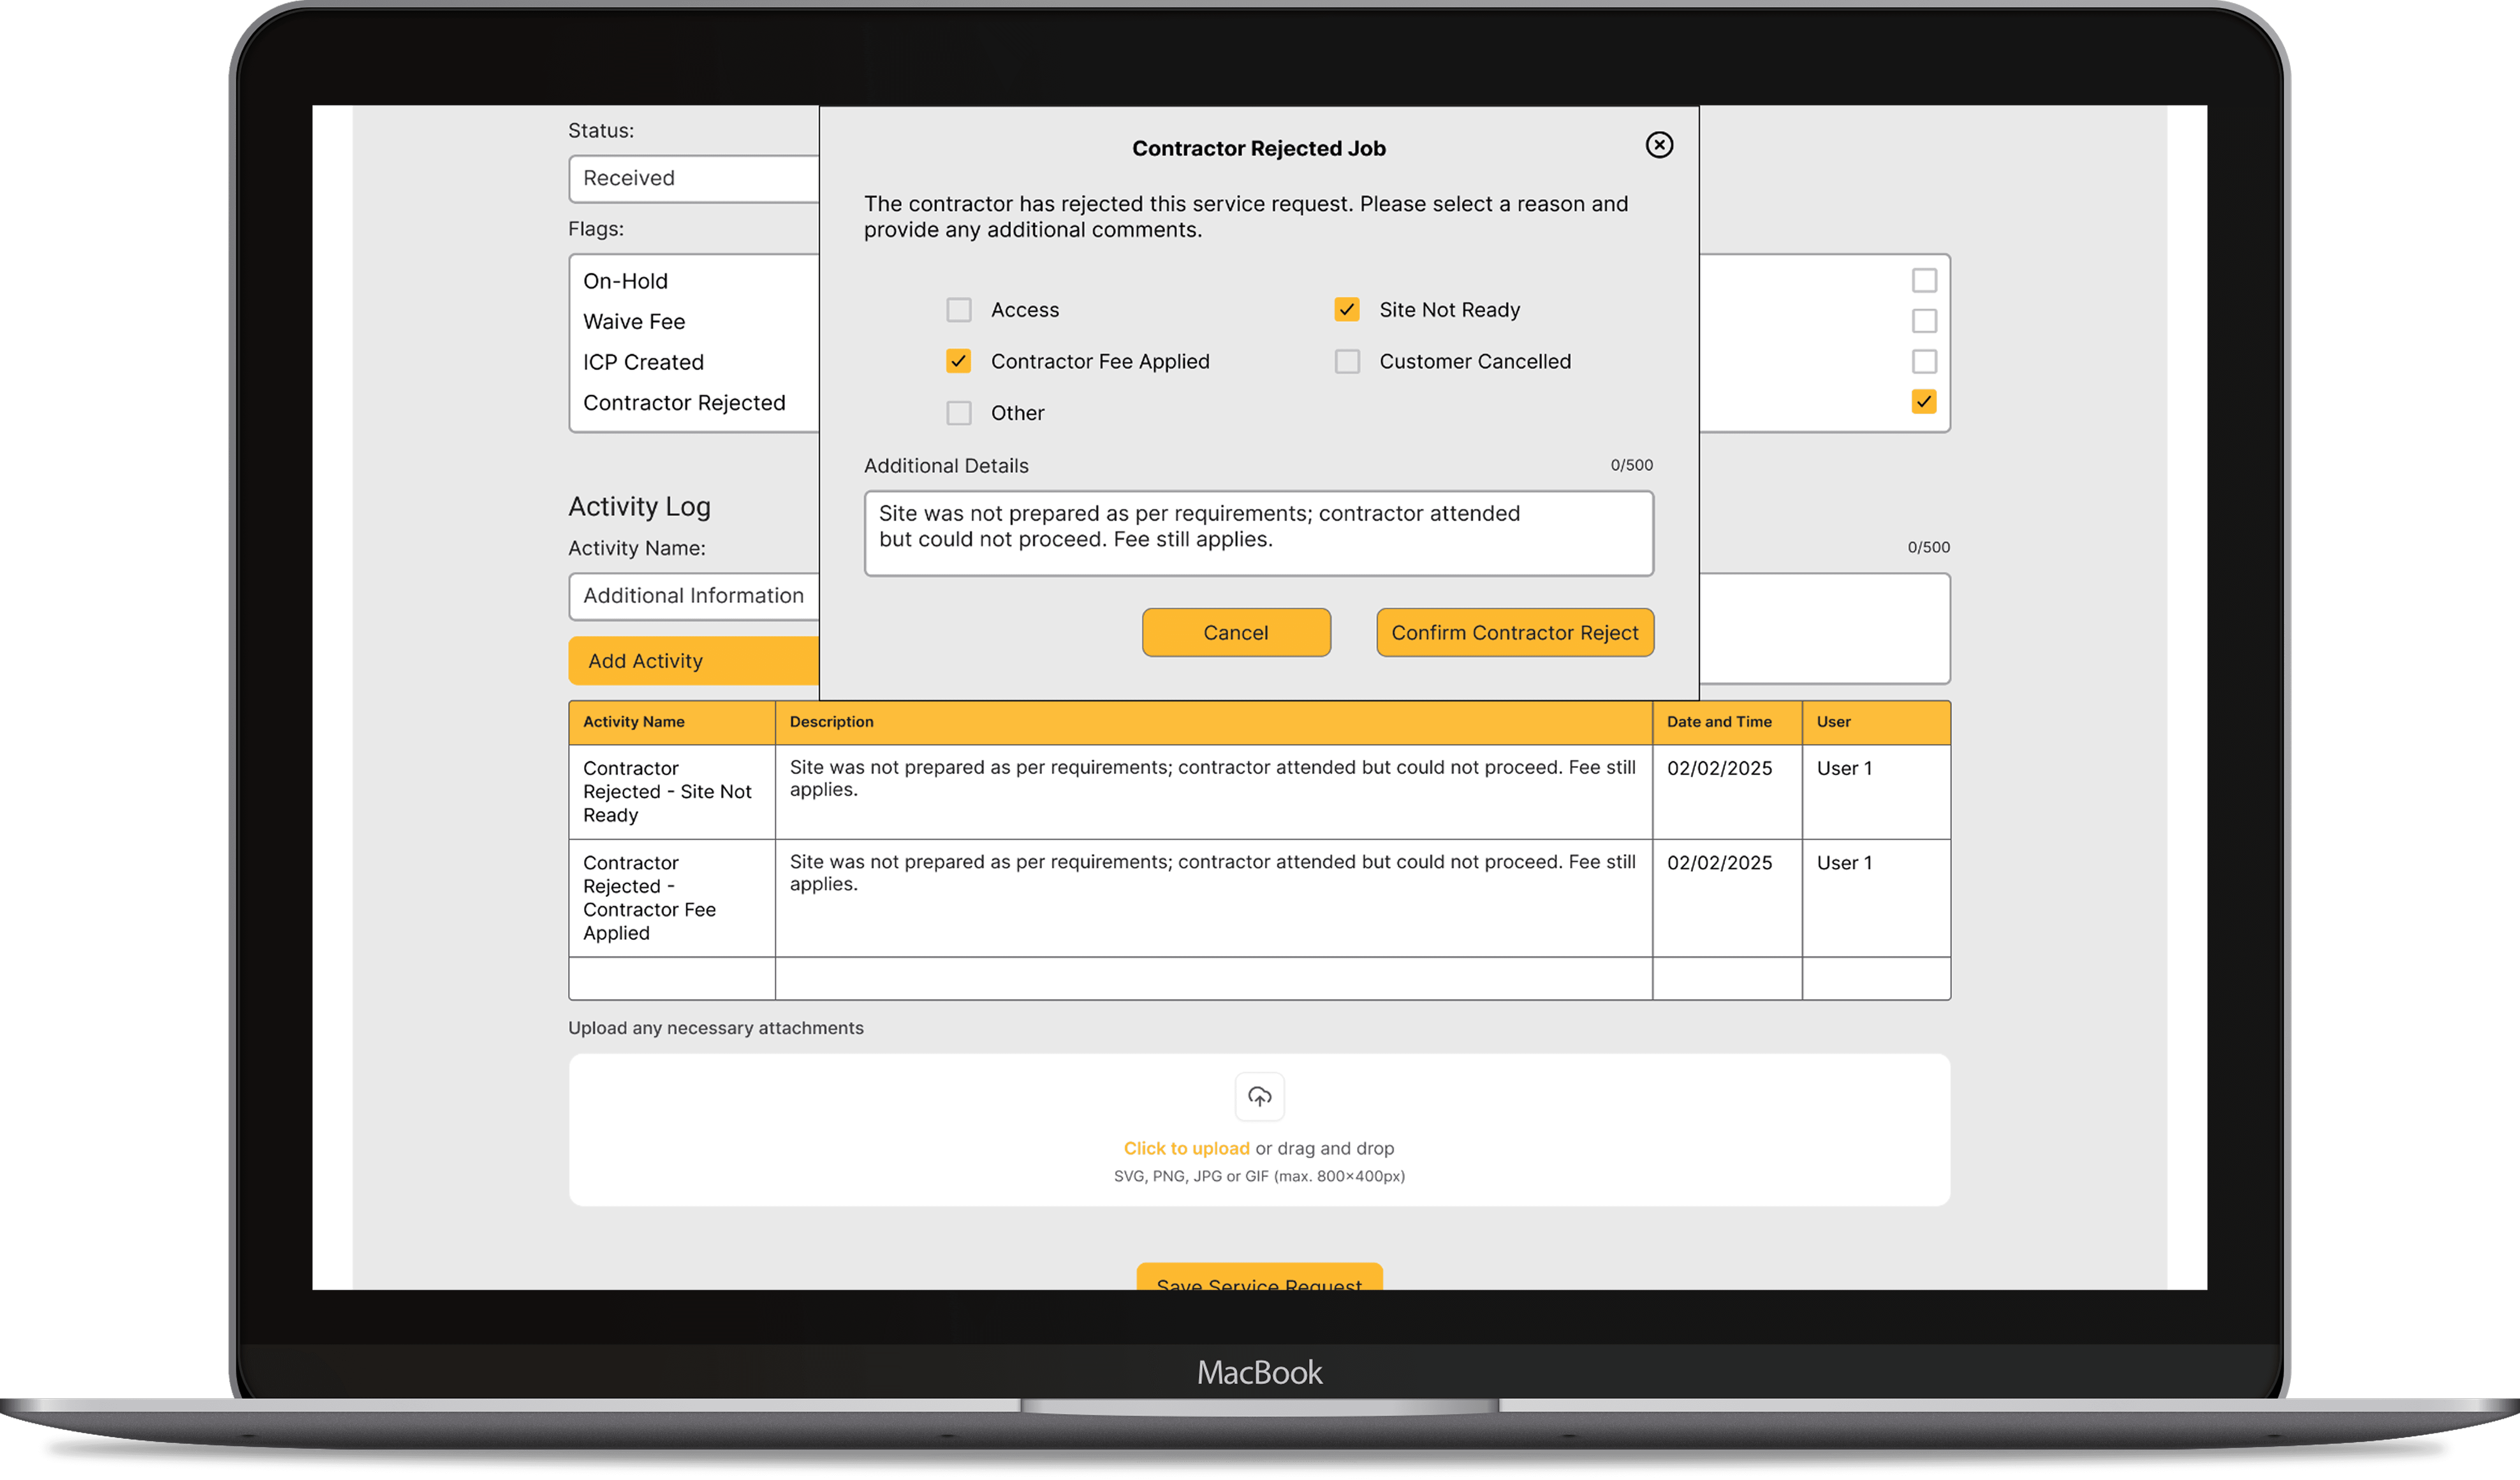
The existing product although functional had some key limitations that included inconsistent export functionality—Excel exports only worked in Chrome, were blocked in Edge, and lacked detailed installation data. Billing logic was incorrect, charging per request instead of per street light. Reports were outdated, status updates required manual fixes after technical glitches, and contractor rejection reasons lacked standardisation. The system also failed to block requests missing essential ICP numbers.
USER PAIN POINTS

Unclear field labeling and mandatory requirements lead to inconsistent contact information and incomplete submissions, causing manual follow-ups and underutilised data.

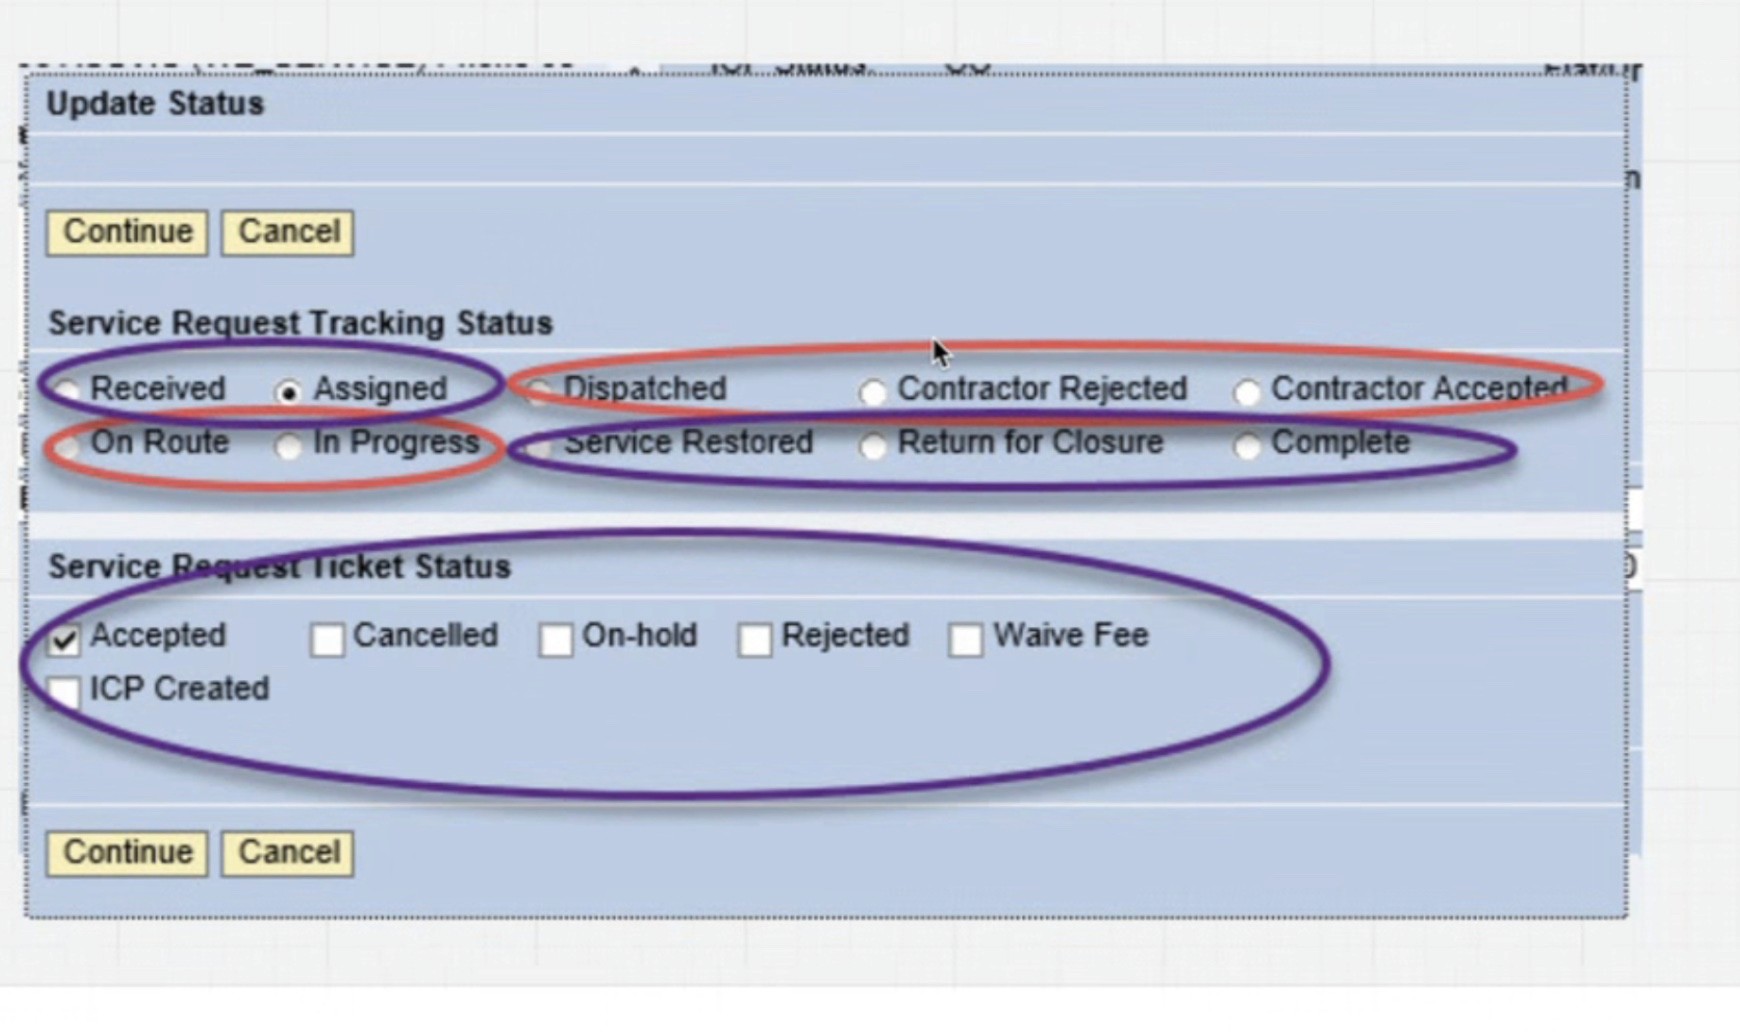
Confusing Status Options (SR Tracking Status & SR Ticket Status)
Consider converting Ticket Status into a tag/label to distinguish it more clearly from tracking status.
Overlap between SR Tracking Status and SR Ticket Status created confusion for users.
Explore automation to reset status where applicable.
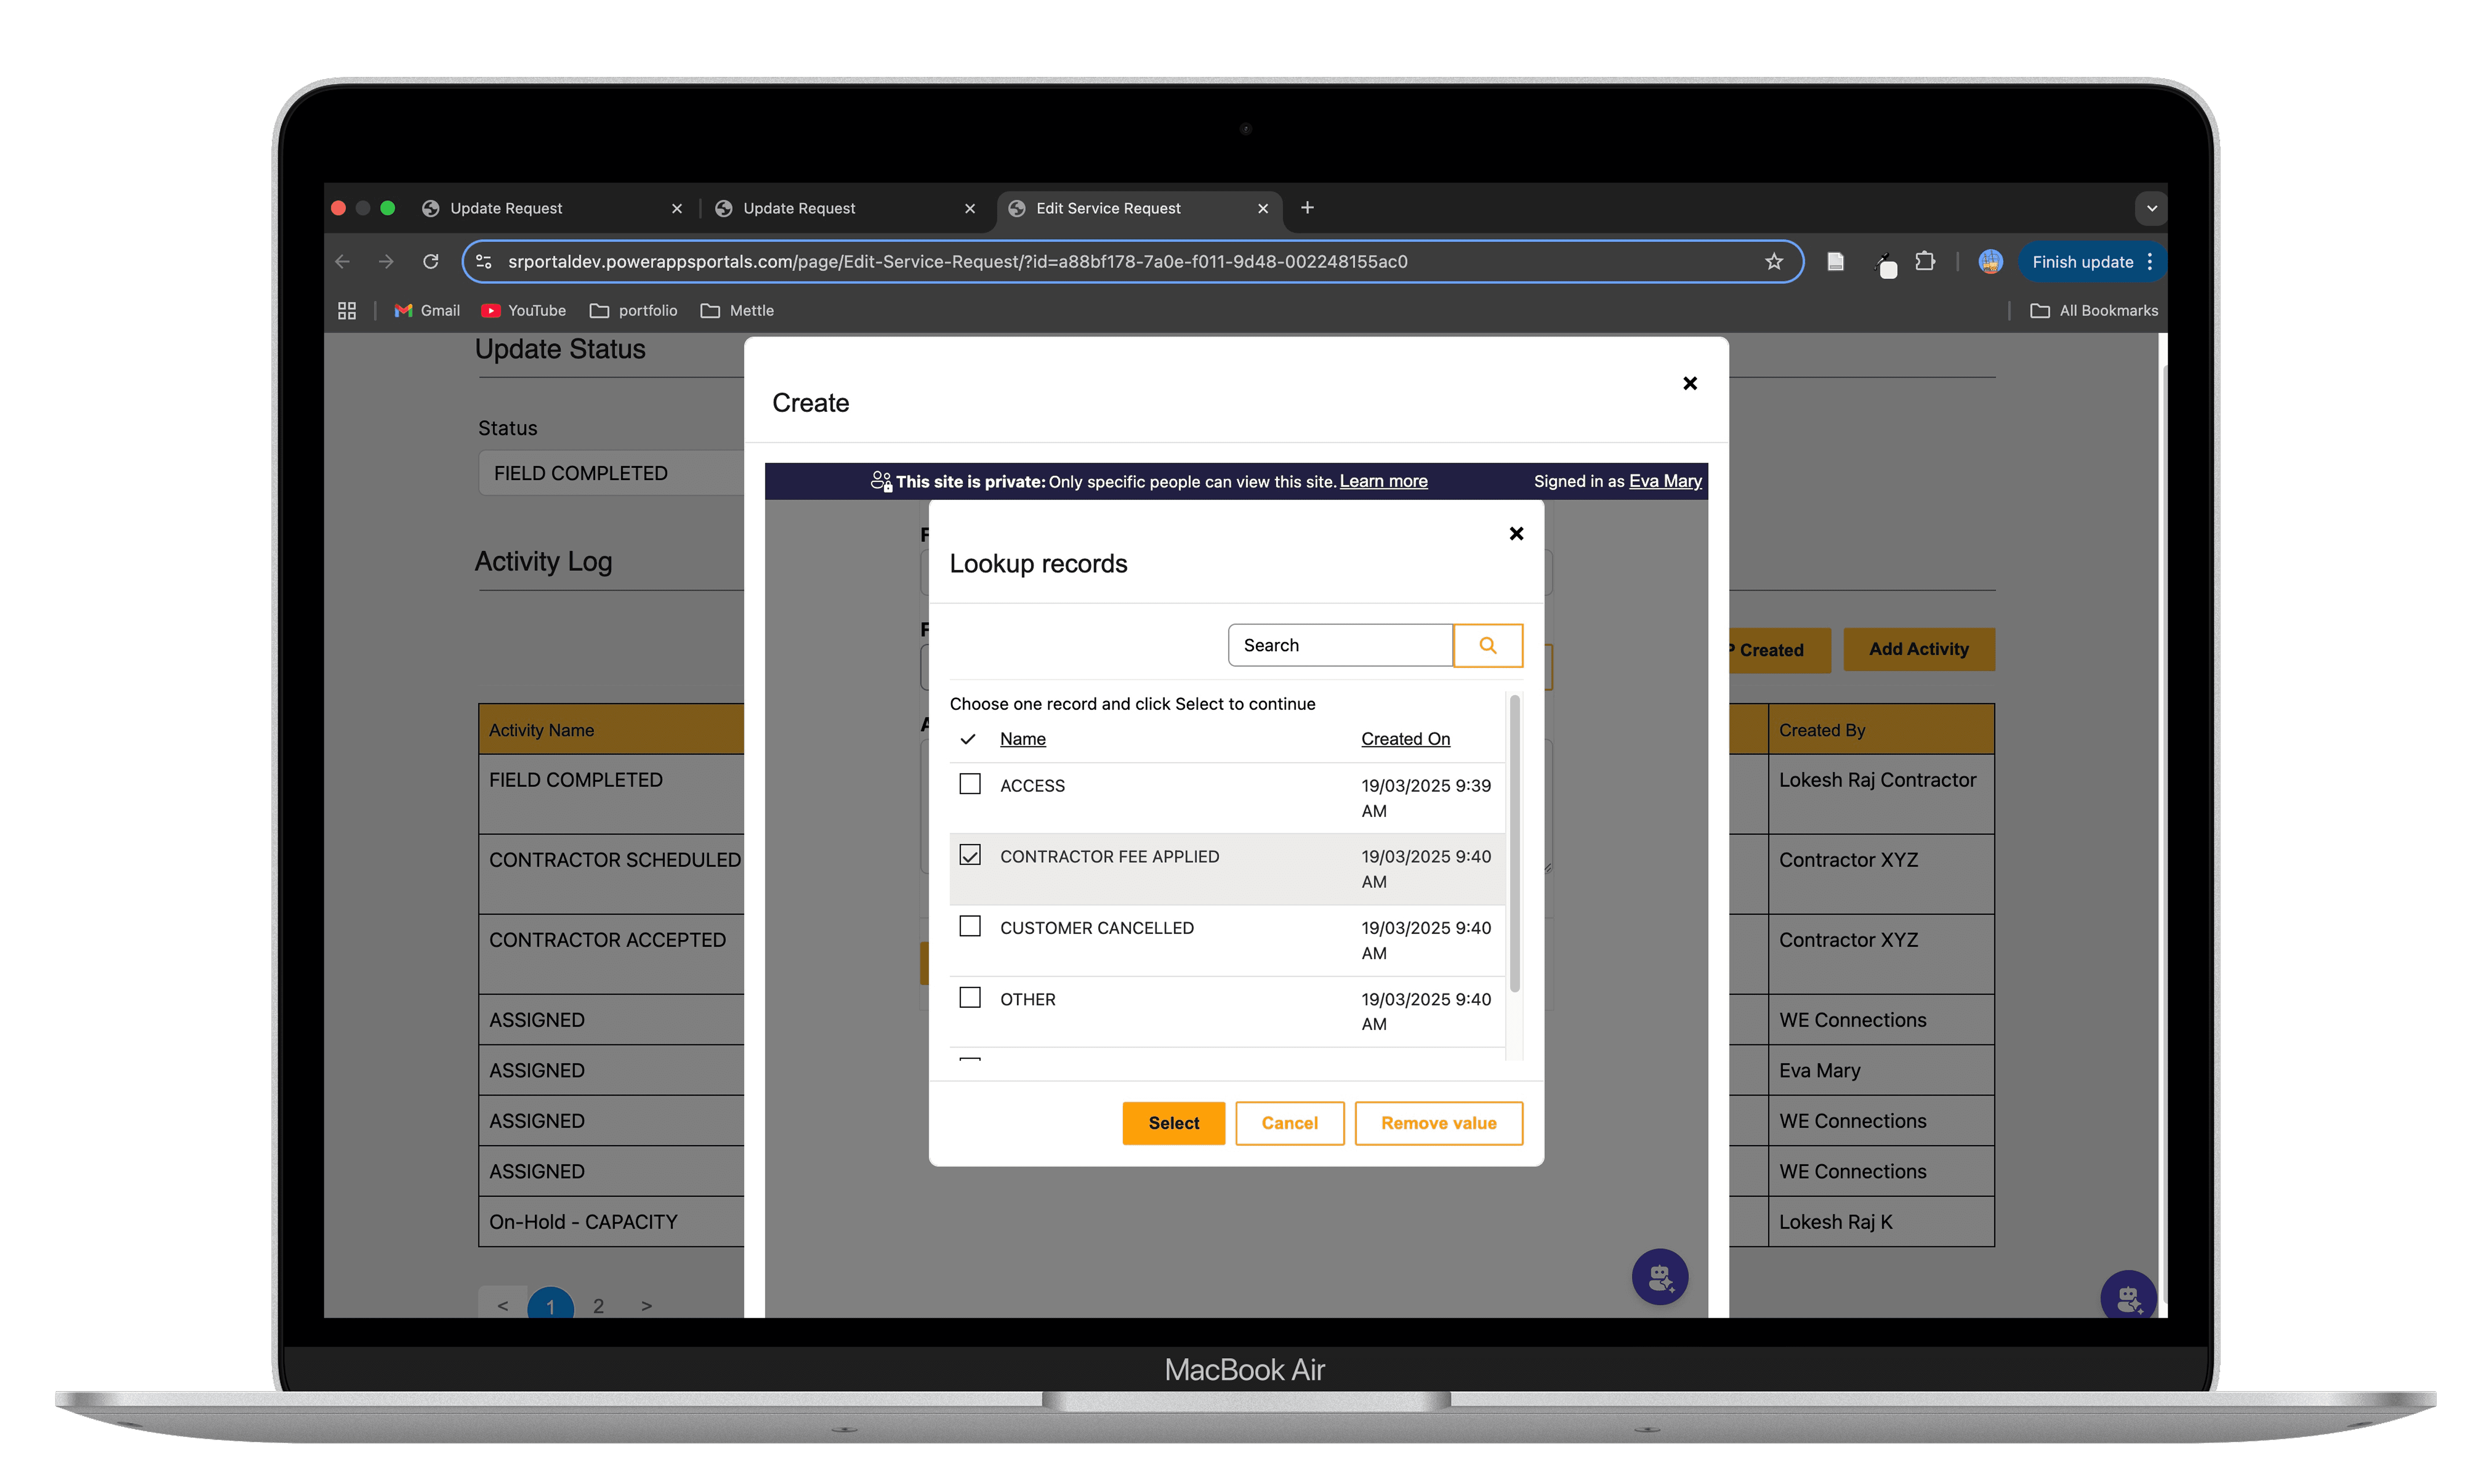
Lack of Status Validation
Risk of contradictory status combinations (e.g., “Accepted” and “Rejected” selected simultaneously).
Validation and dropdown inputs are needed to prevent user error and maintain data consistency.
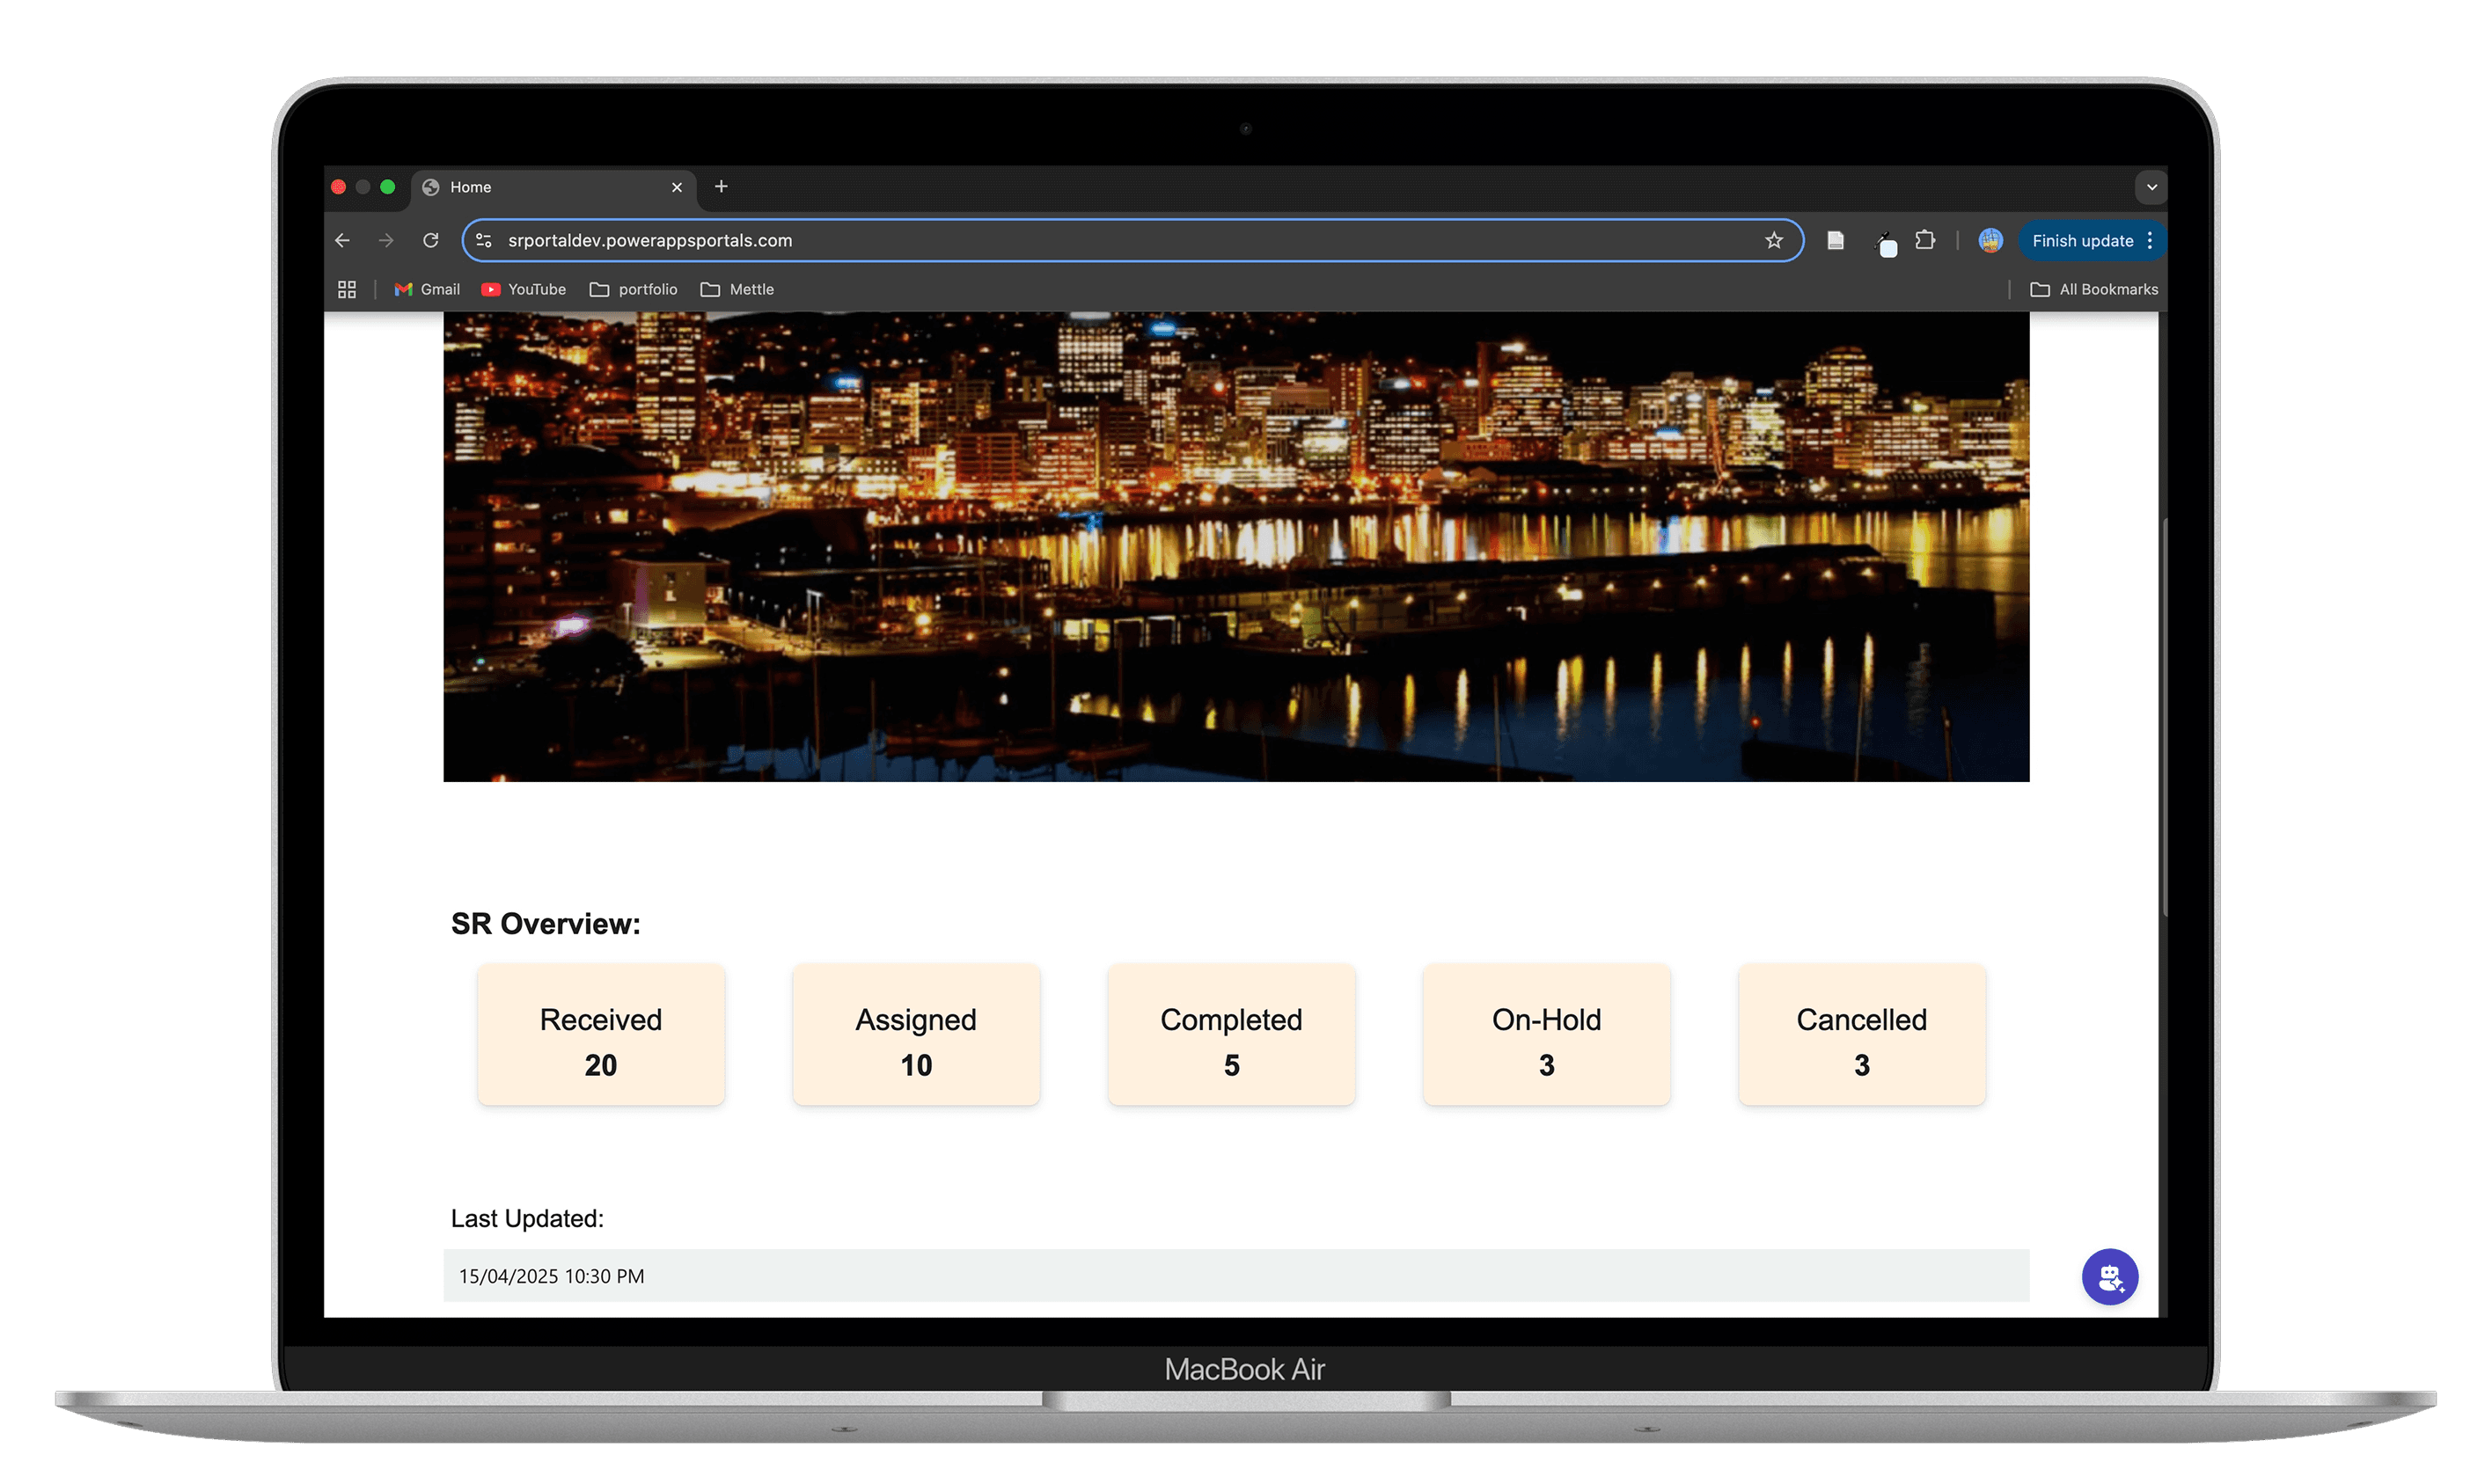
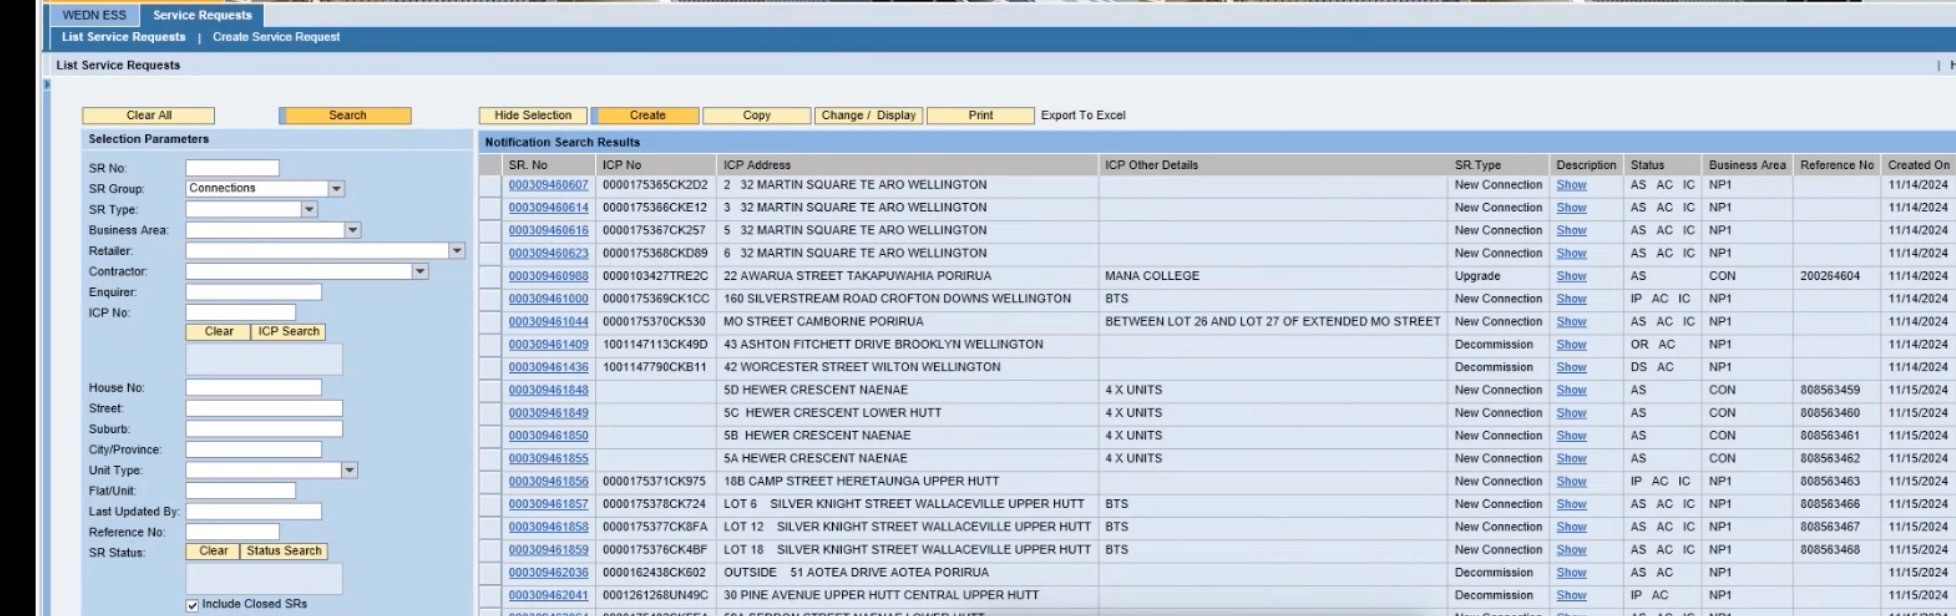
Current Portal

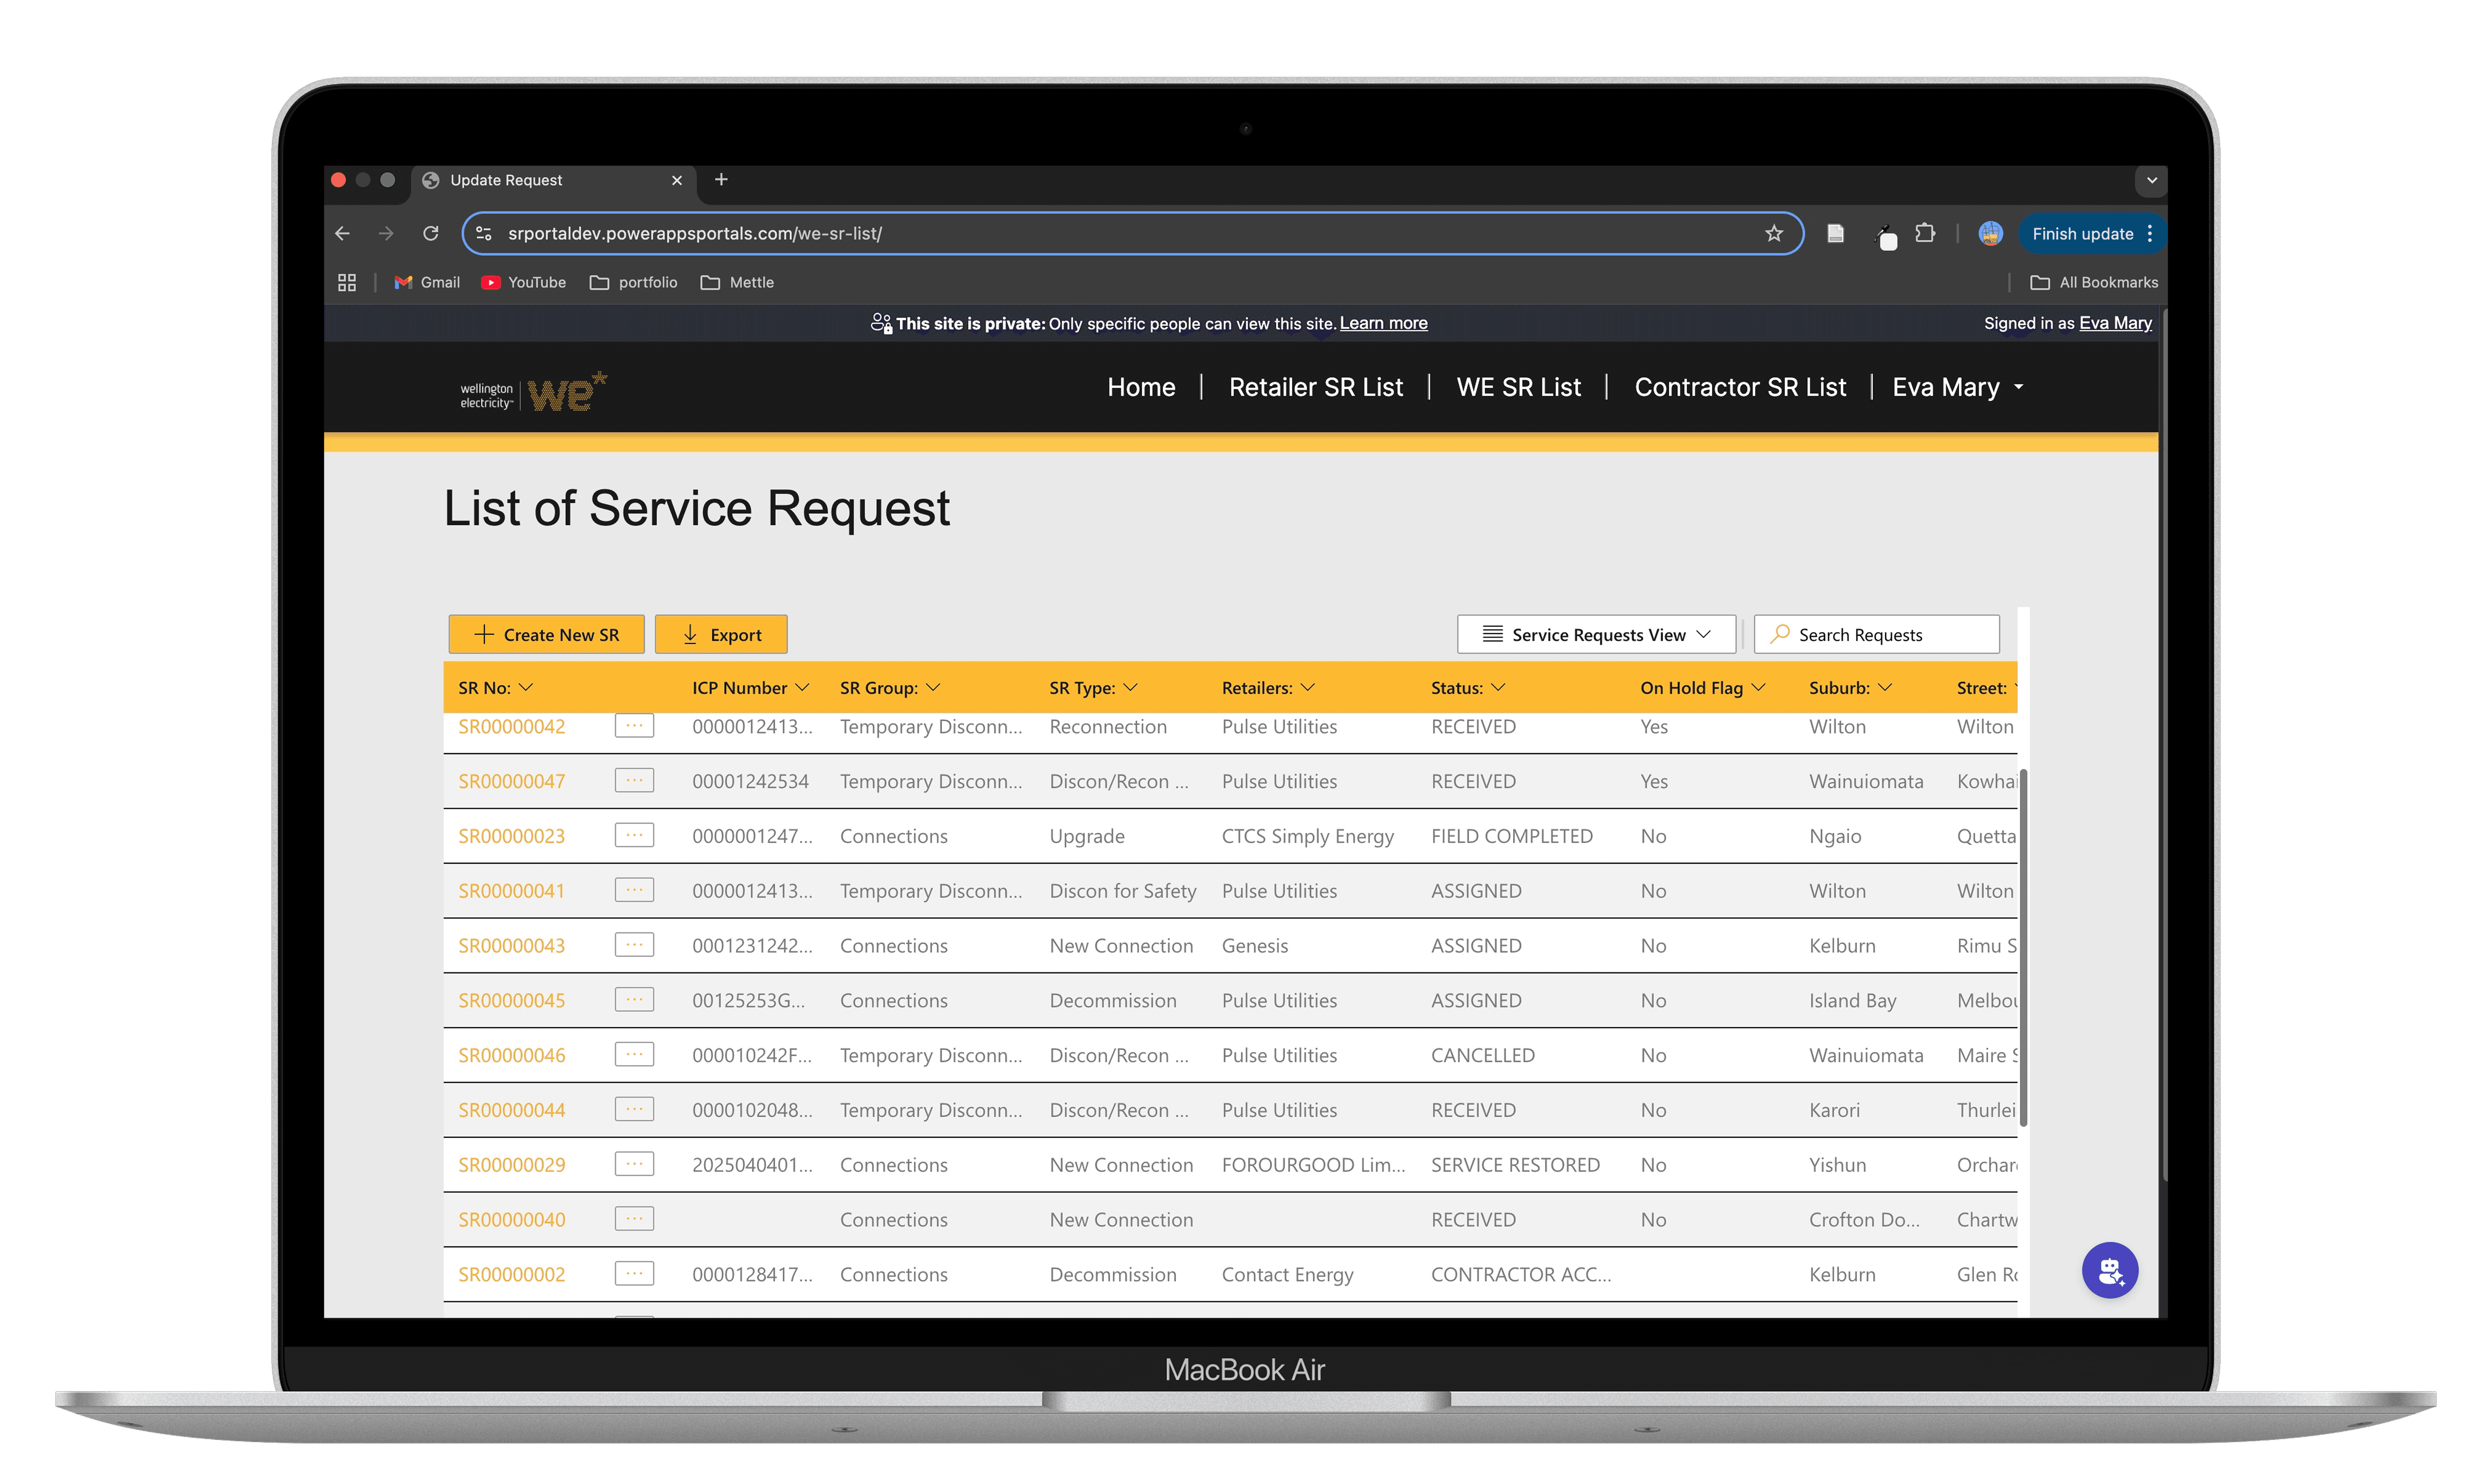
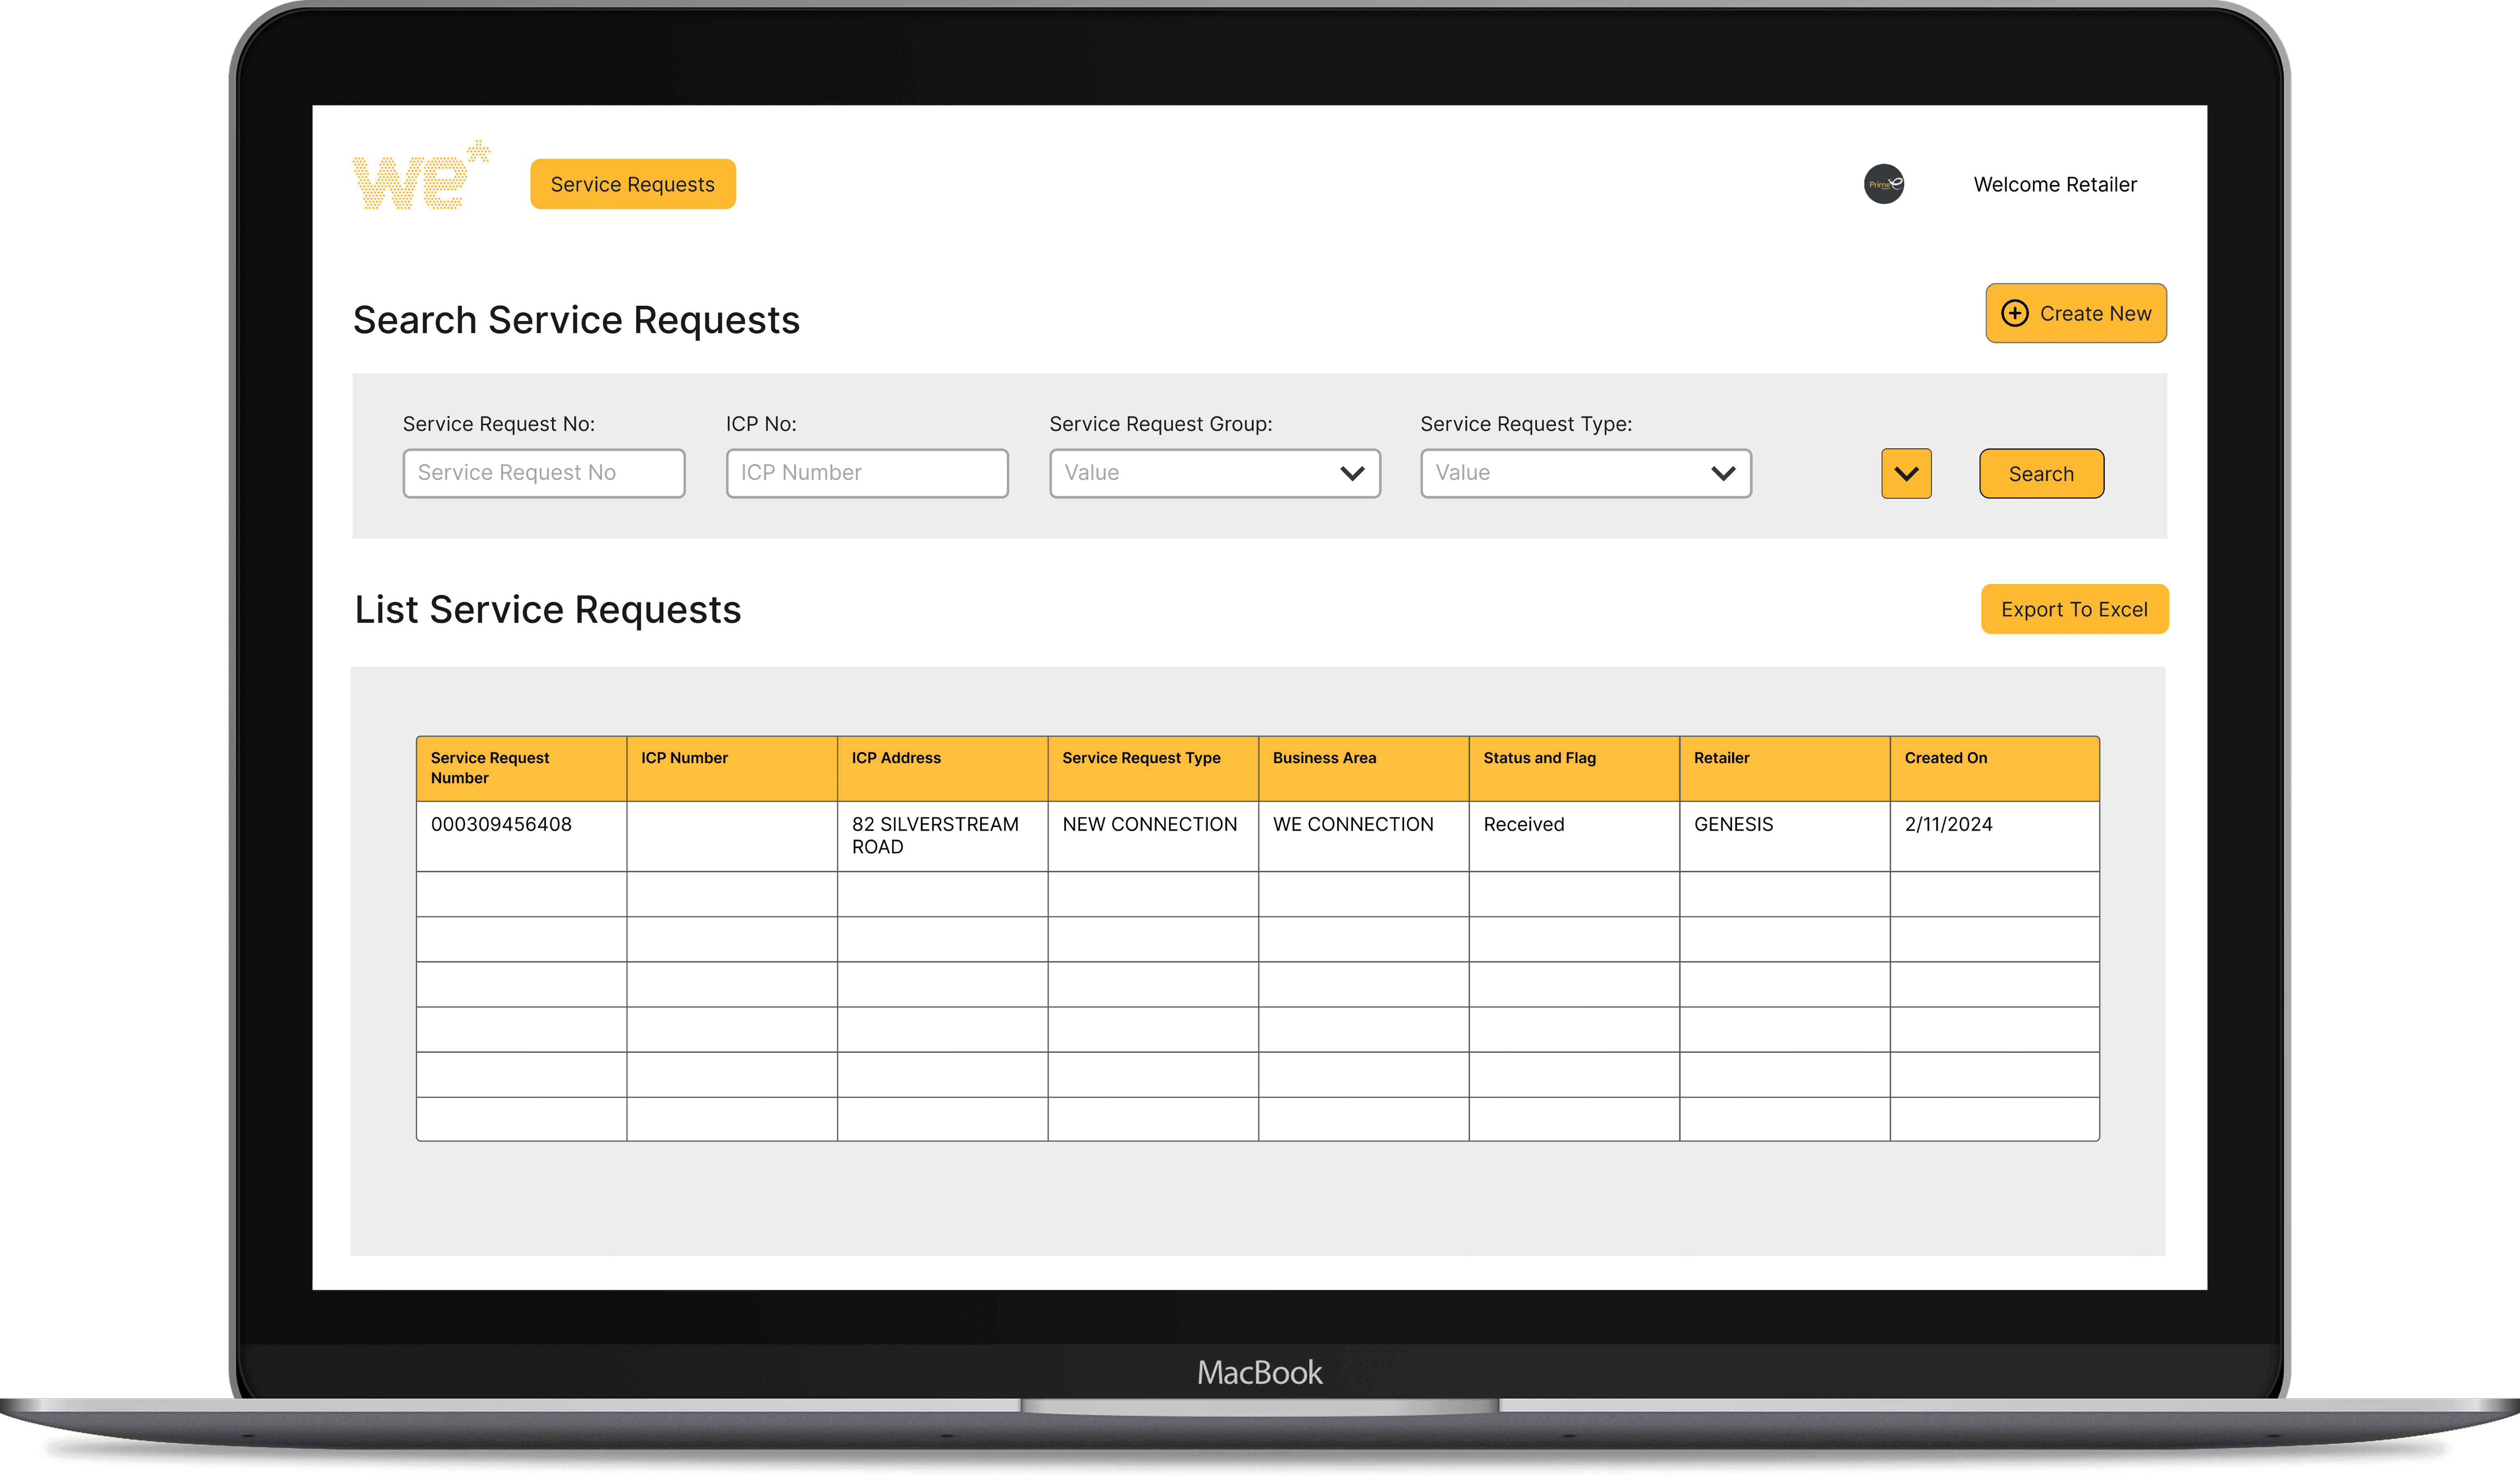
Cluttered Search Screen
The existing search interface is visually overwhelming.
New design introduces only key filters (e.g., SR Number, ISP Number, Status, Address, Dates), with secondary filters hidden to reduce clutter.
Large Tables and User Experience (UX) Redesign
Current tables are too wide, causing key fields to be hidden especially in the retailer portal.
A redesigned layout improves readability and accessibility of all necessary fields.
Overly Long Lists
Excessive SR entries make it hard to find specific requests.
Better pagination and filtering will help users locate information more efficiently.
Current Portal

Address discrepancies, character limits, and rigid field formats create friction in data entry. Improvements include confirming address mismatches with Gentrack, reviewing character limits, refining the 'Date Required' field based on request type, and enabling custom capacity inputs for greater flexibility.
PROBLEM STATEMENT
The current Portal has the following risks including an Unsupported Java Platform, SAP being behind on upgrades, several UX Issues and Potential Cyber Risk. The SR Portal supports business functions which cannot effectively be performed if the portal fails.
REDESIGN GOALS
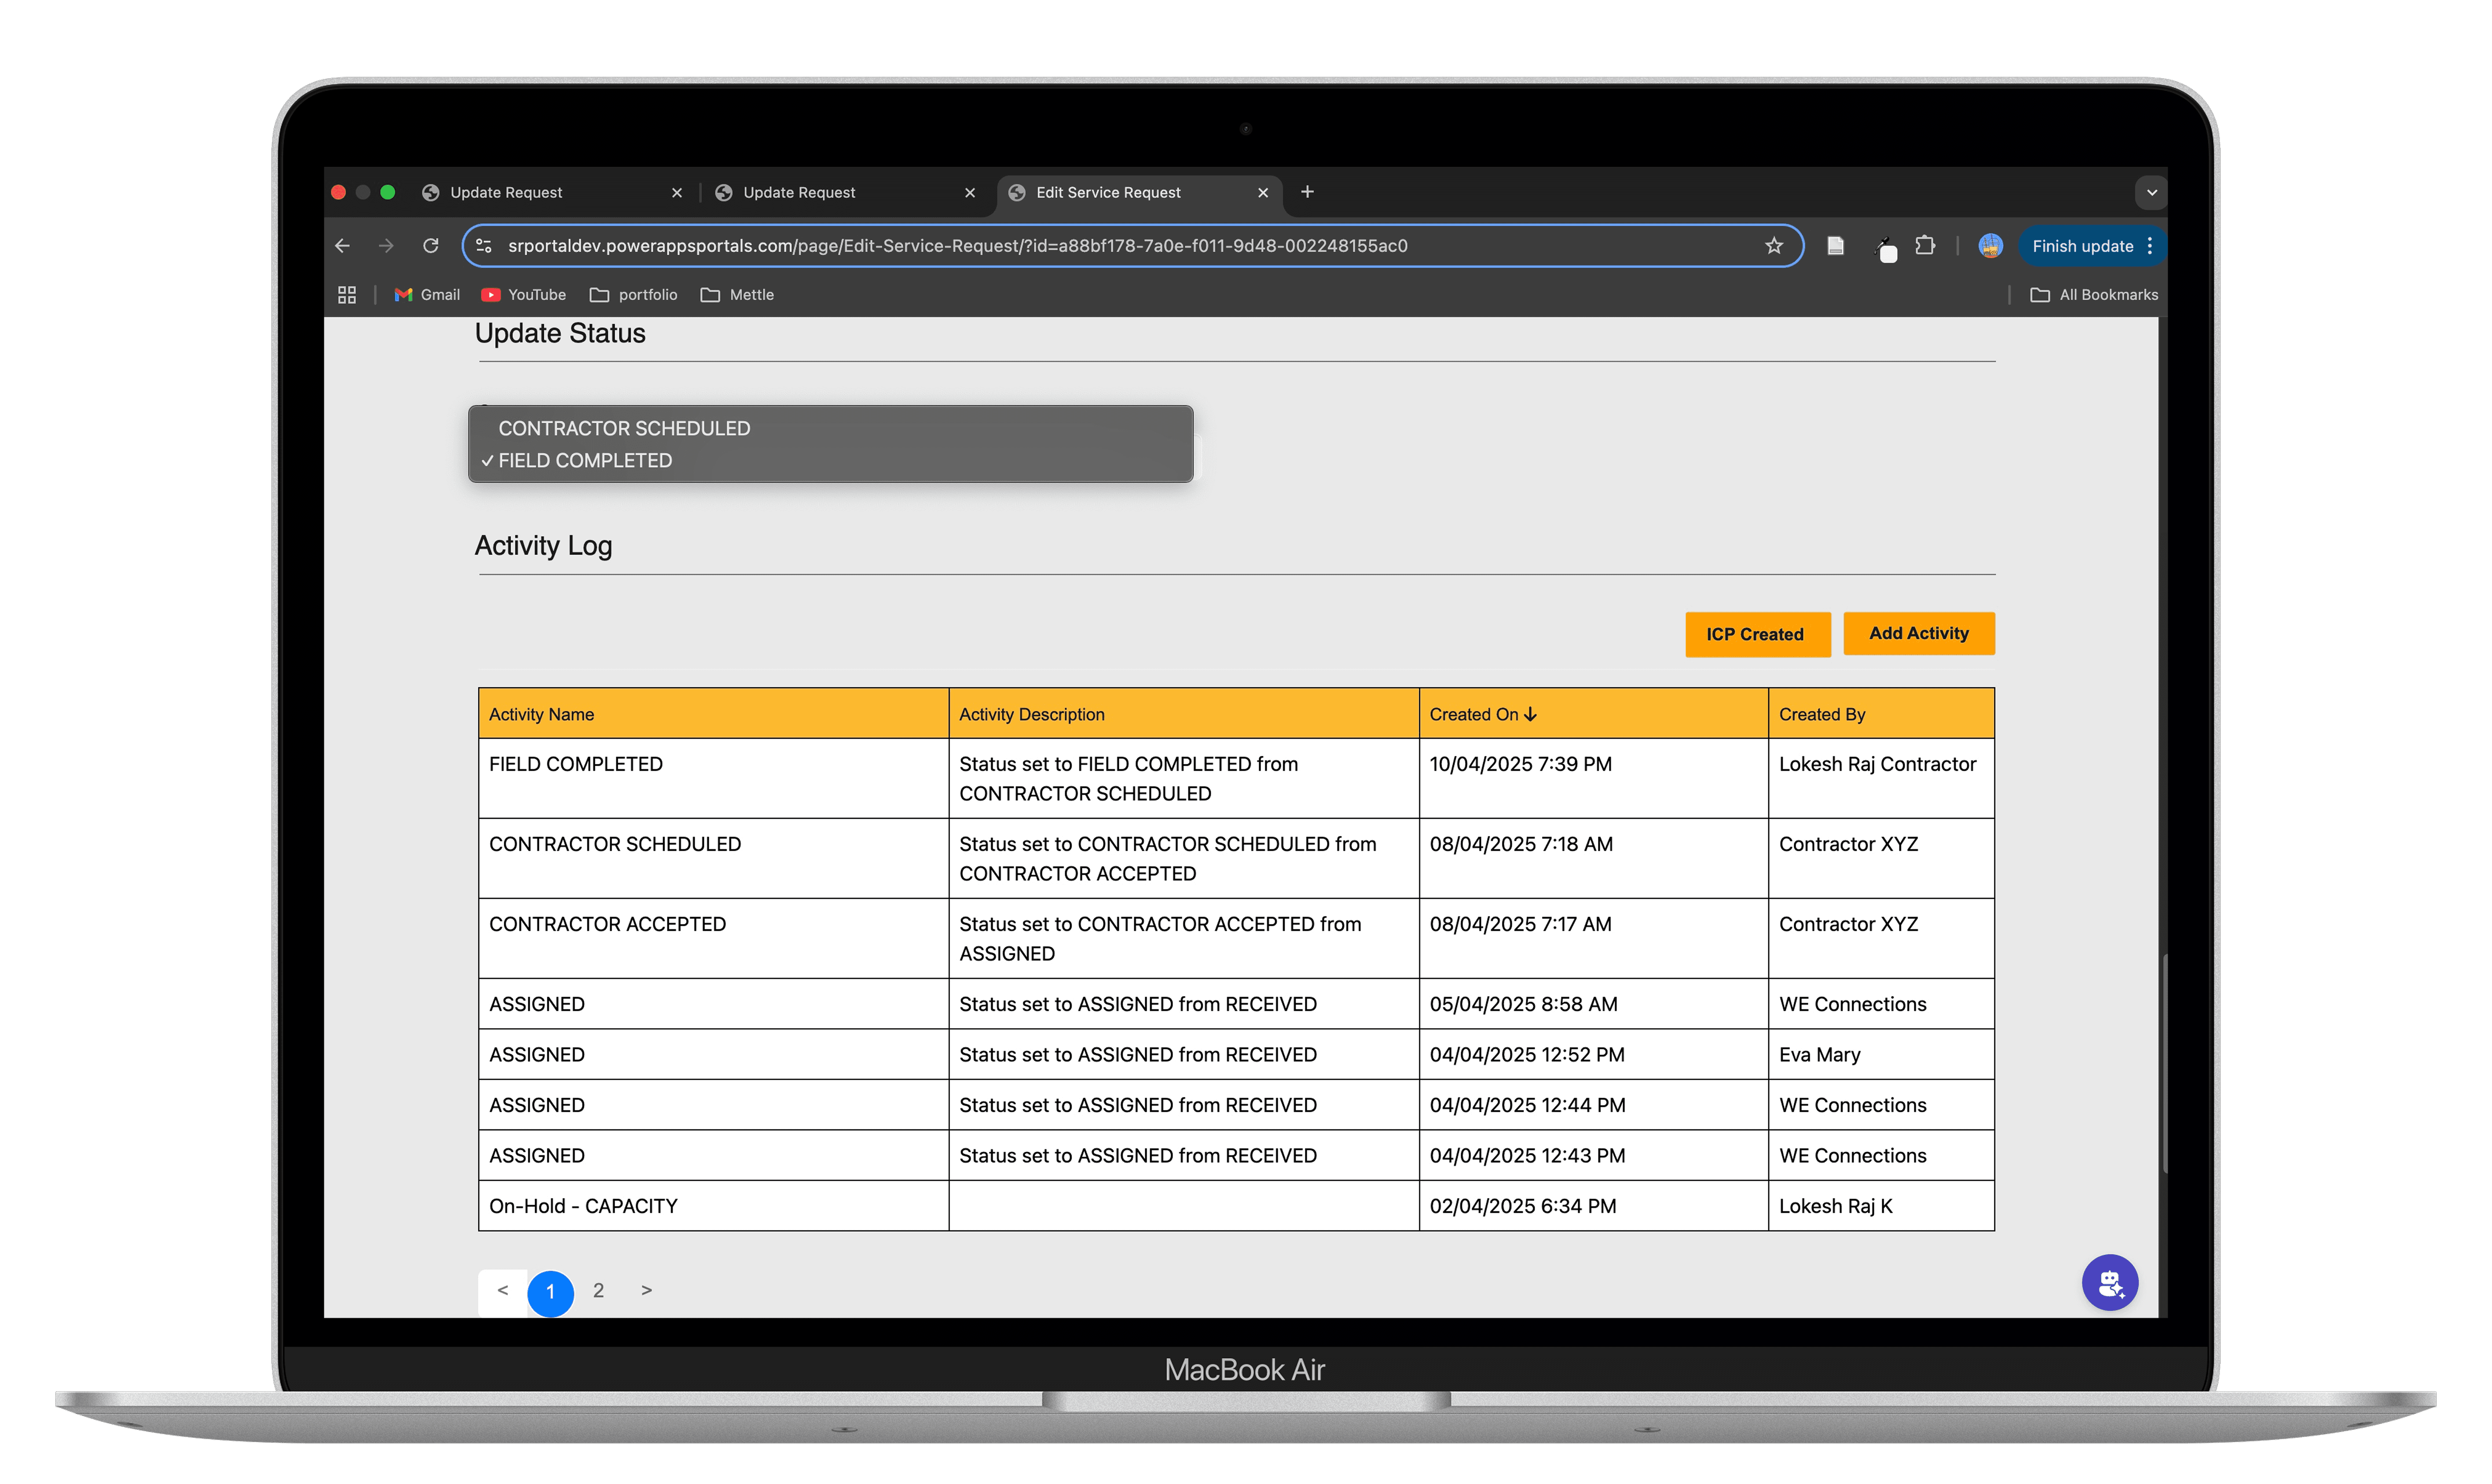
Define a robust data schema that includes field-level constraints such as character limits and improved input validation.
Redesign the status tracking system to clearly separate lifecycle statuses from flags, with built-in validation to prevent users from skipping required steps.
Introduce mandatory contact fields to ensure clear site-level communication and accountability.
Streamline the search interface by decluttering the UI, simplifying result tables, and implementing focused filters for quicker request retrieval.
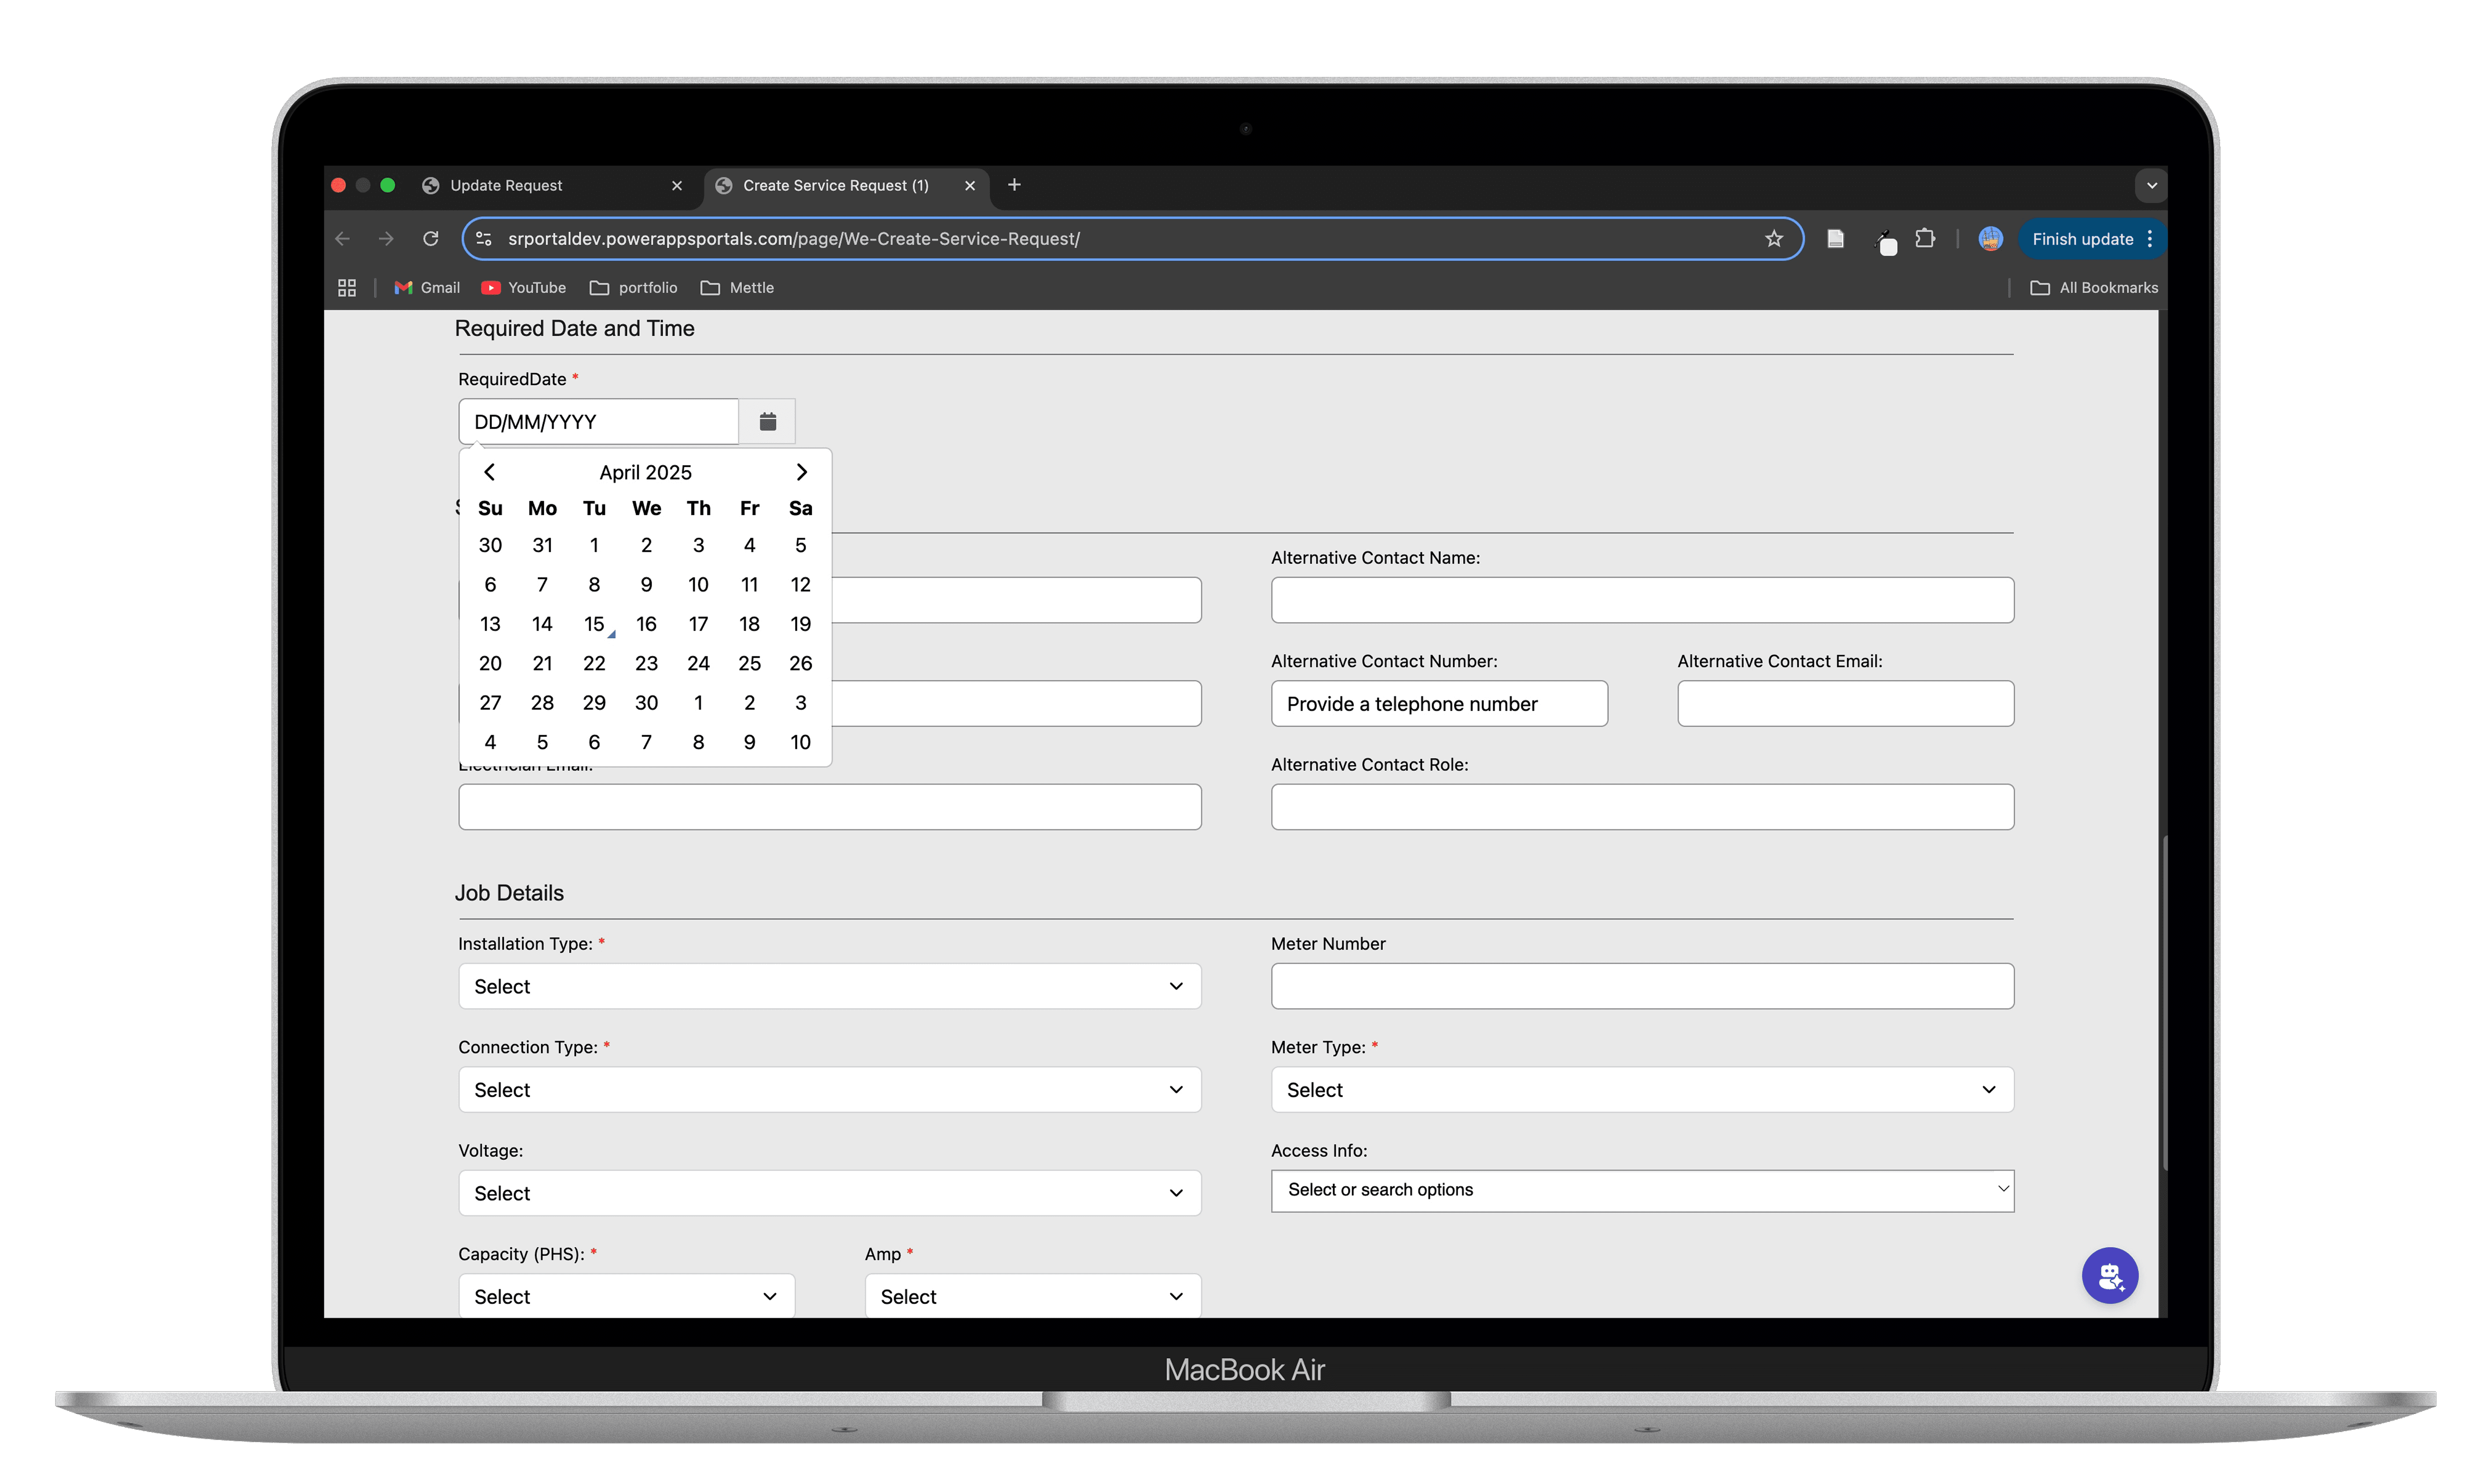
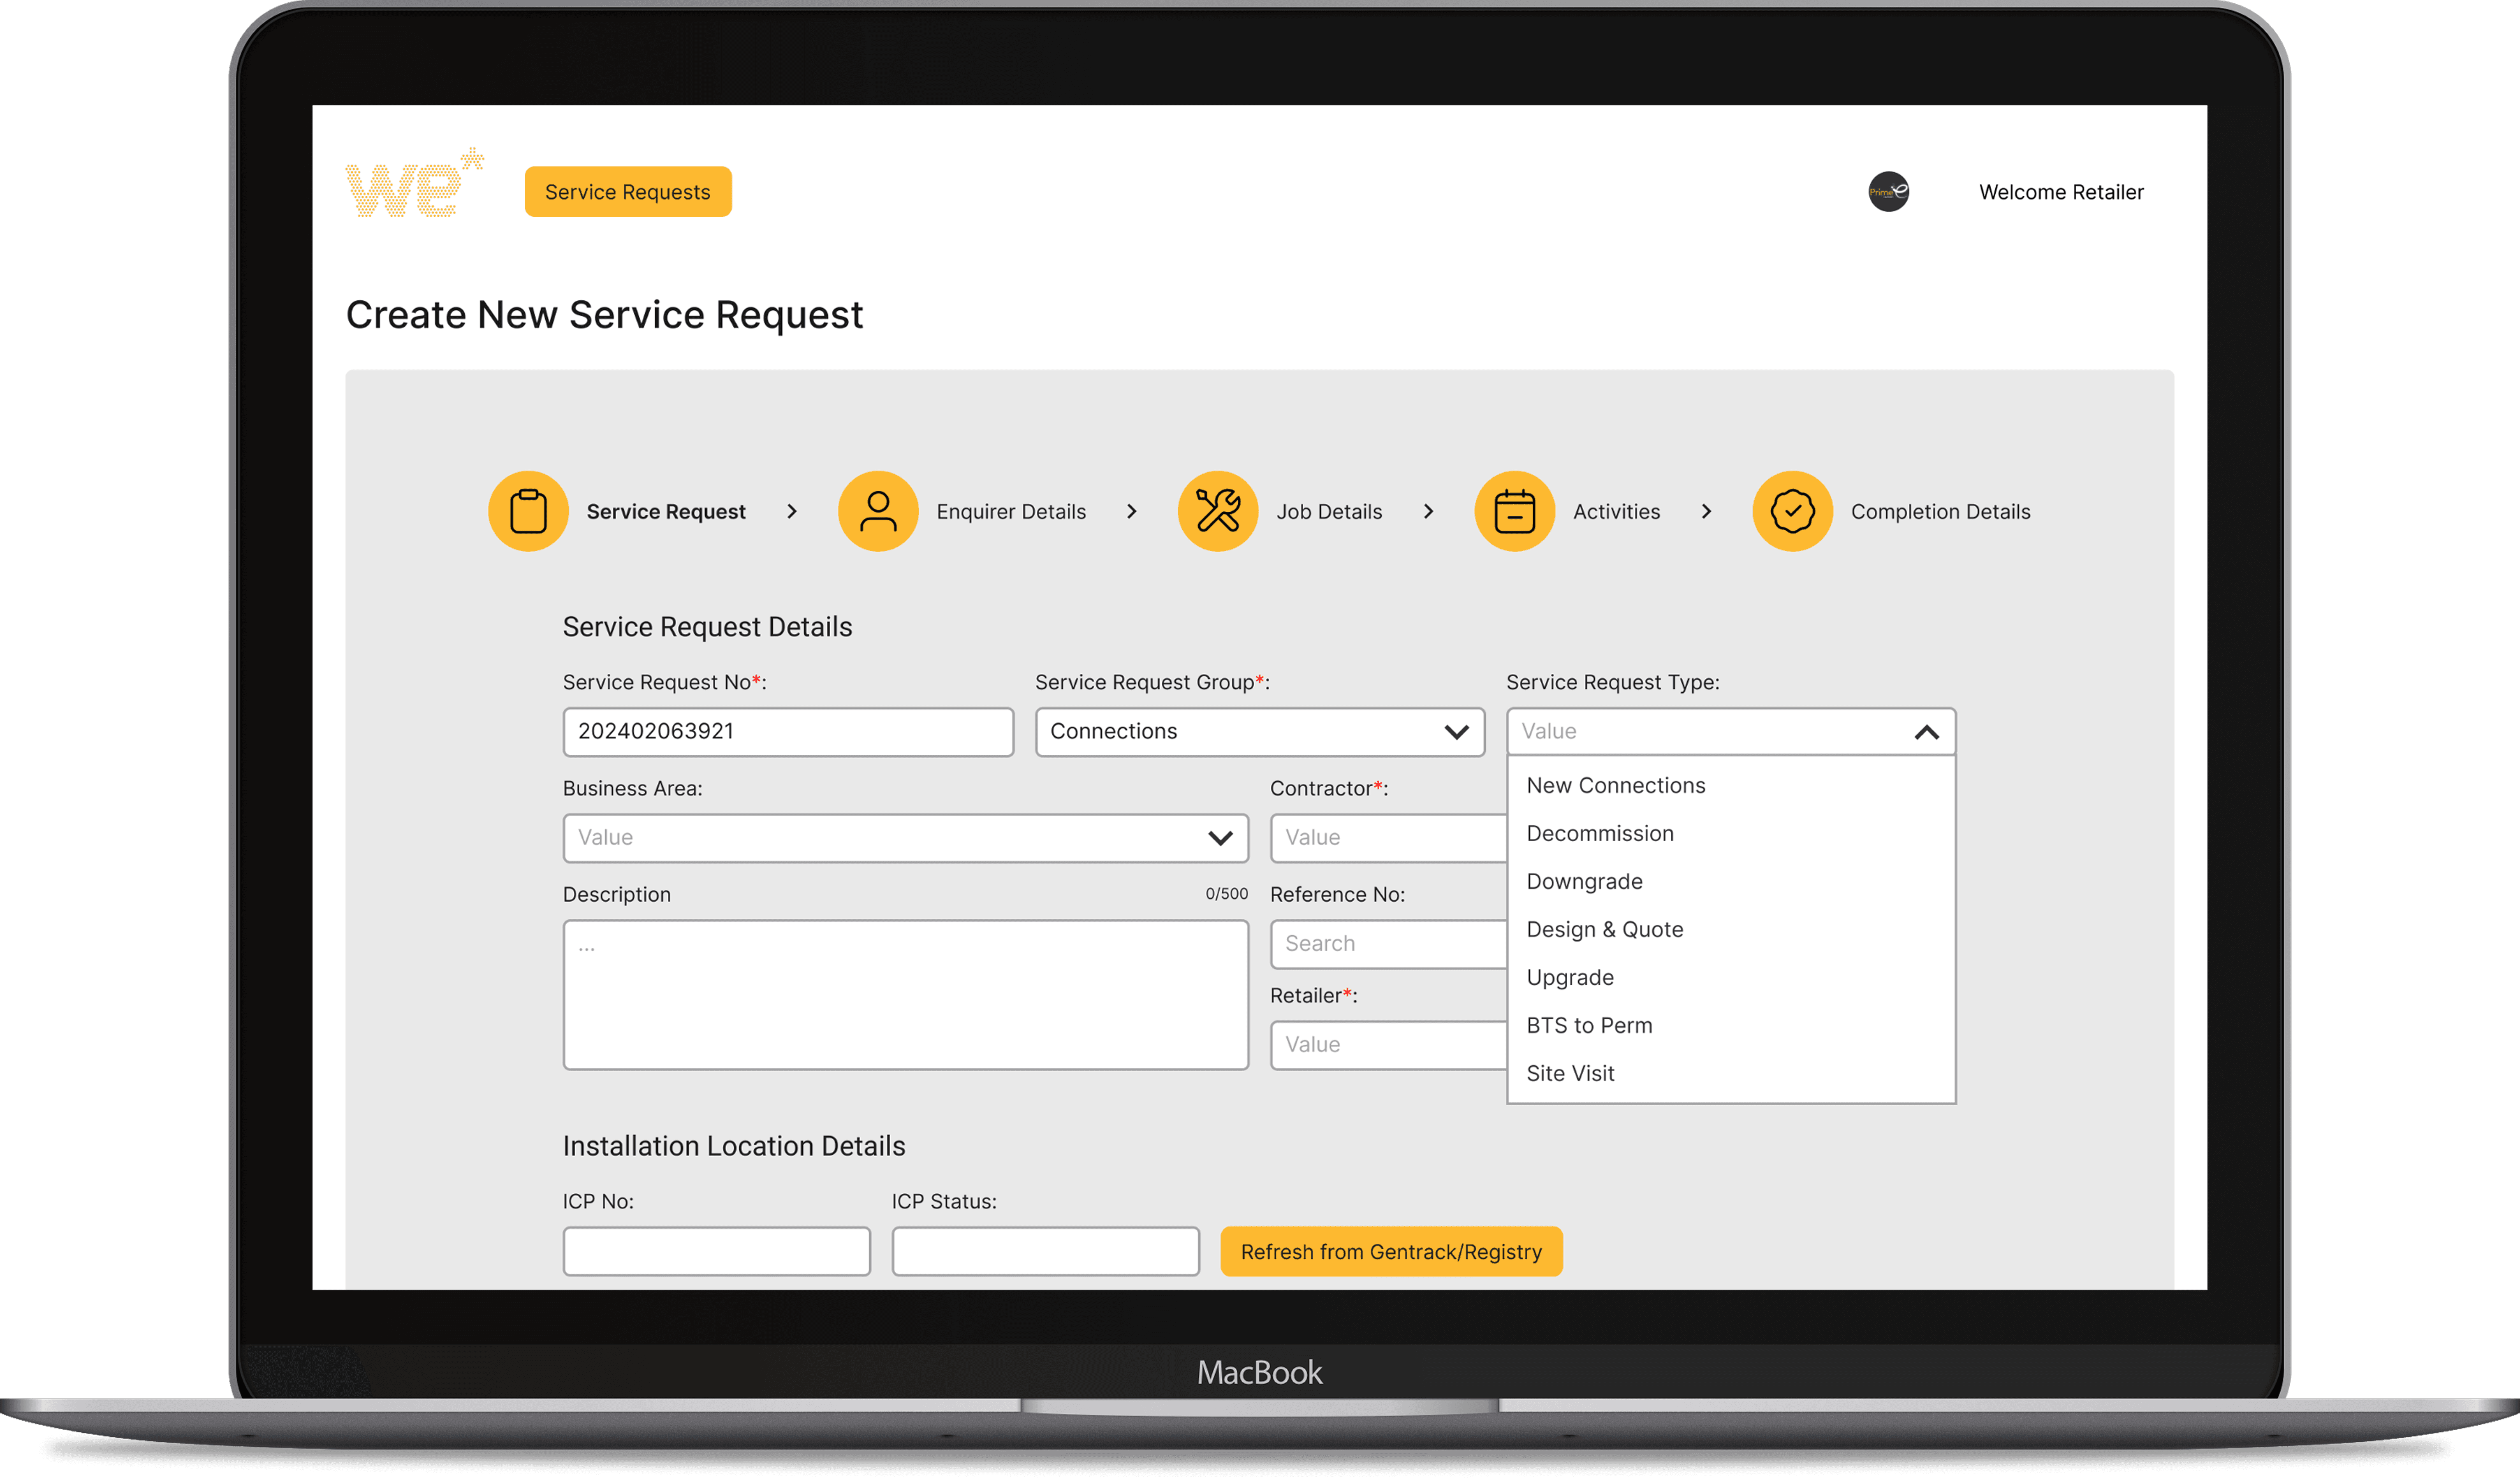
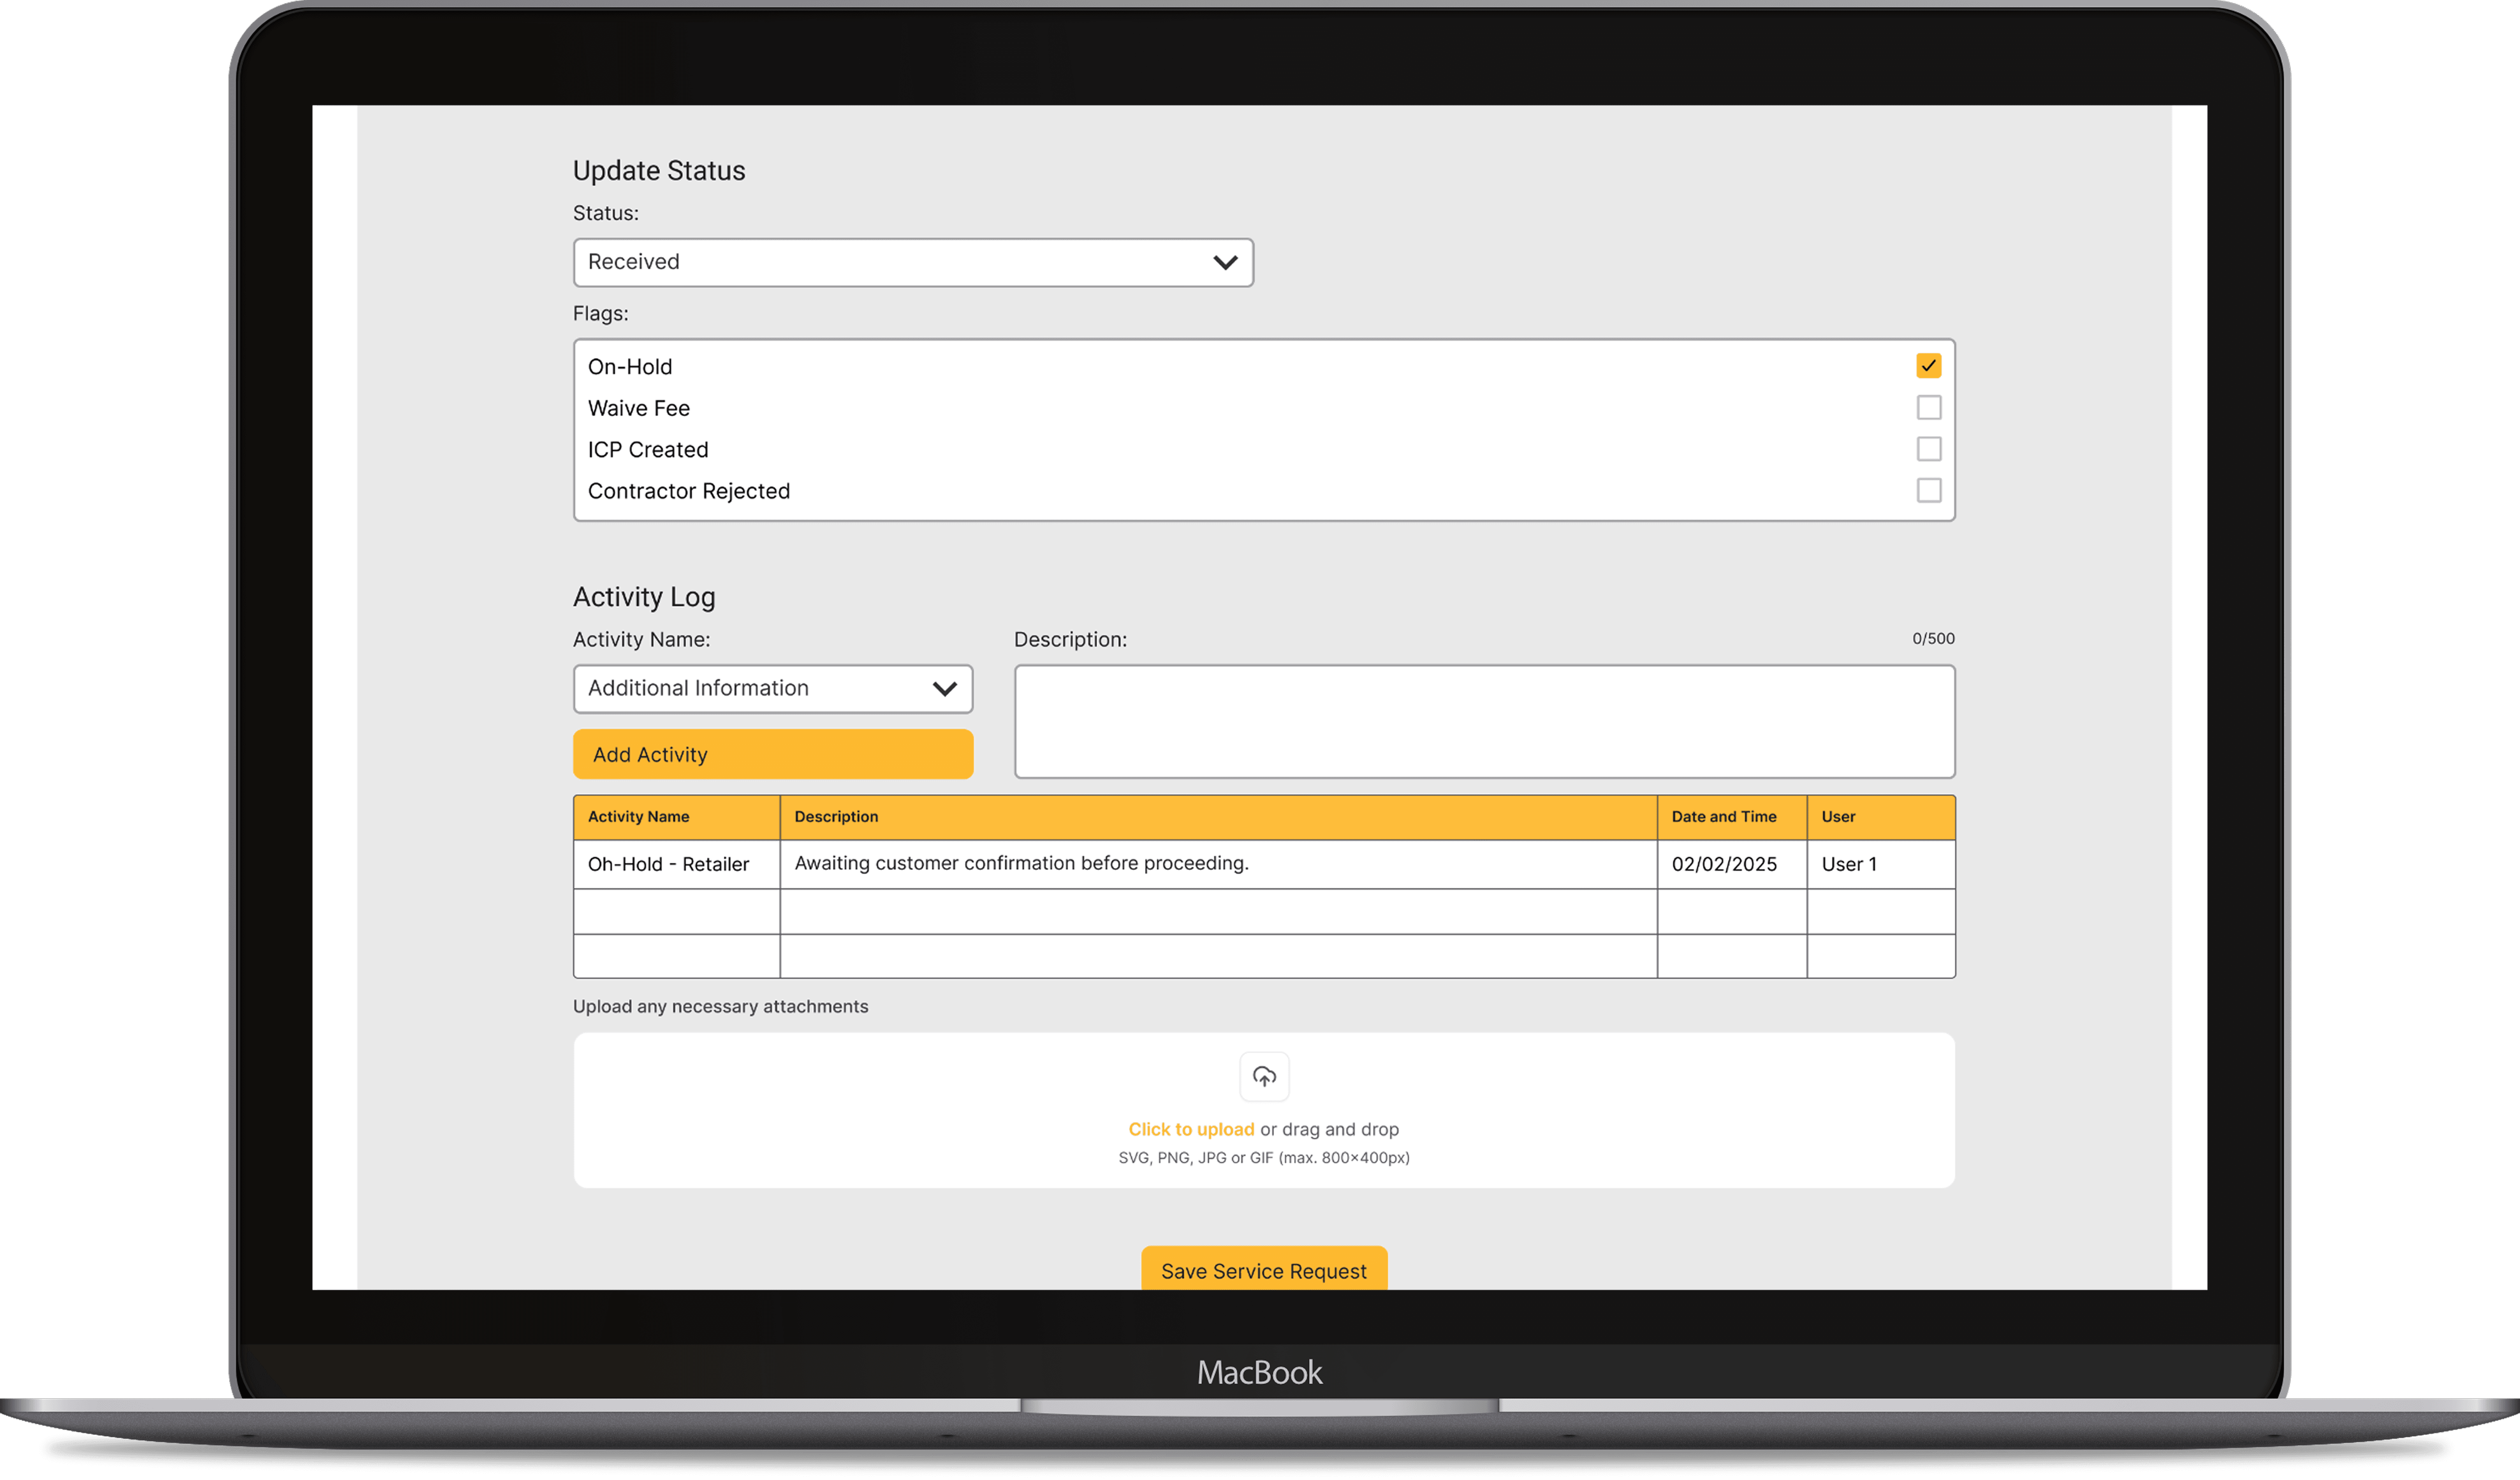
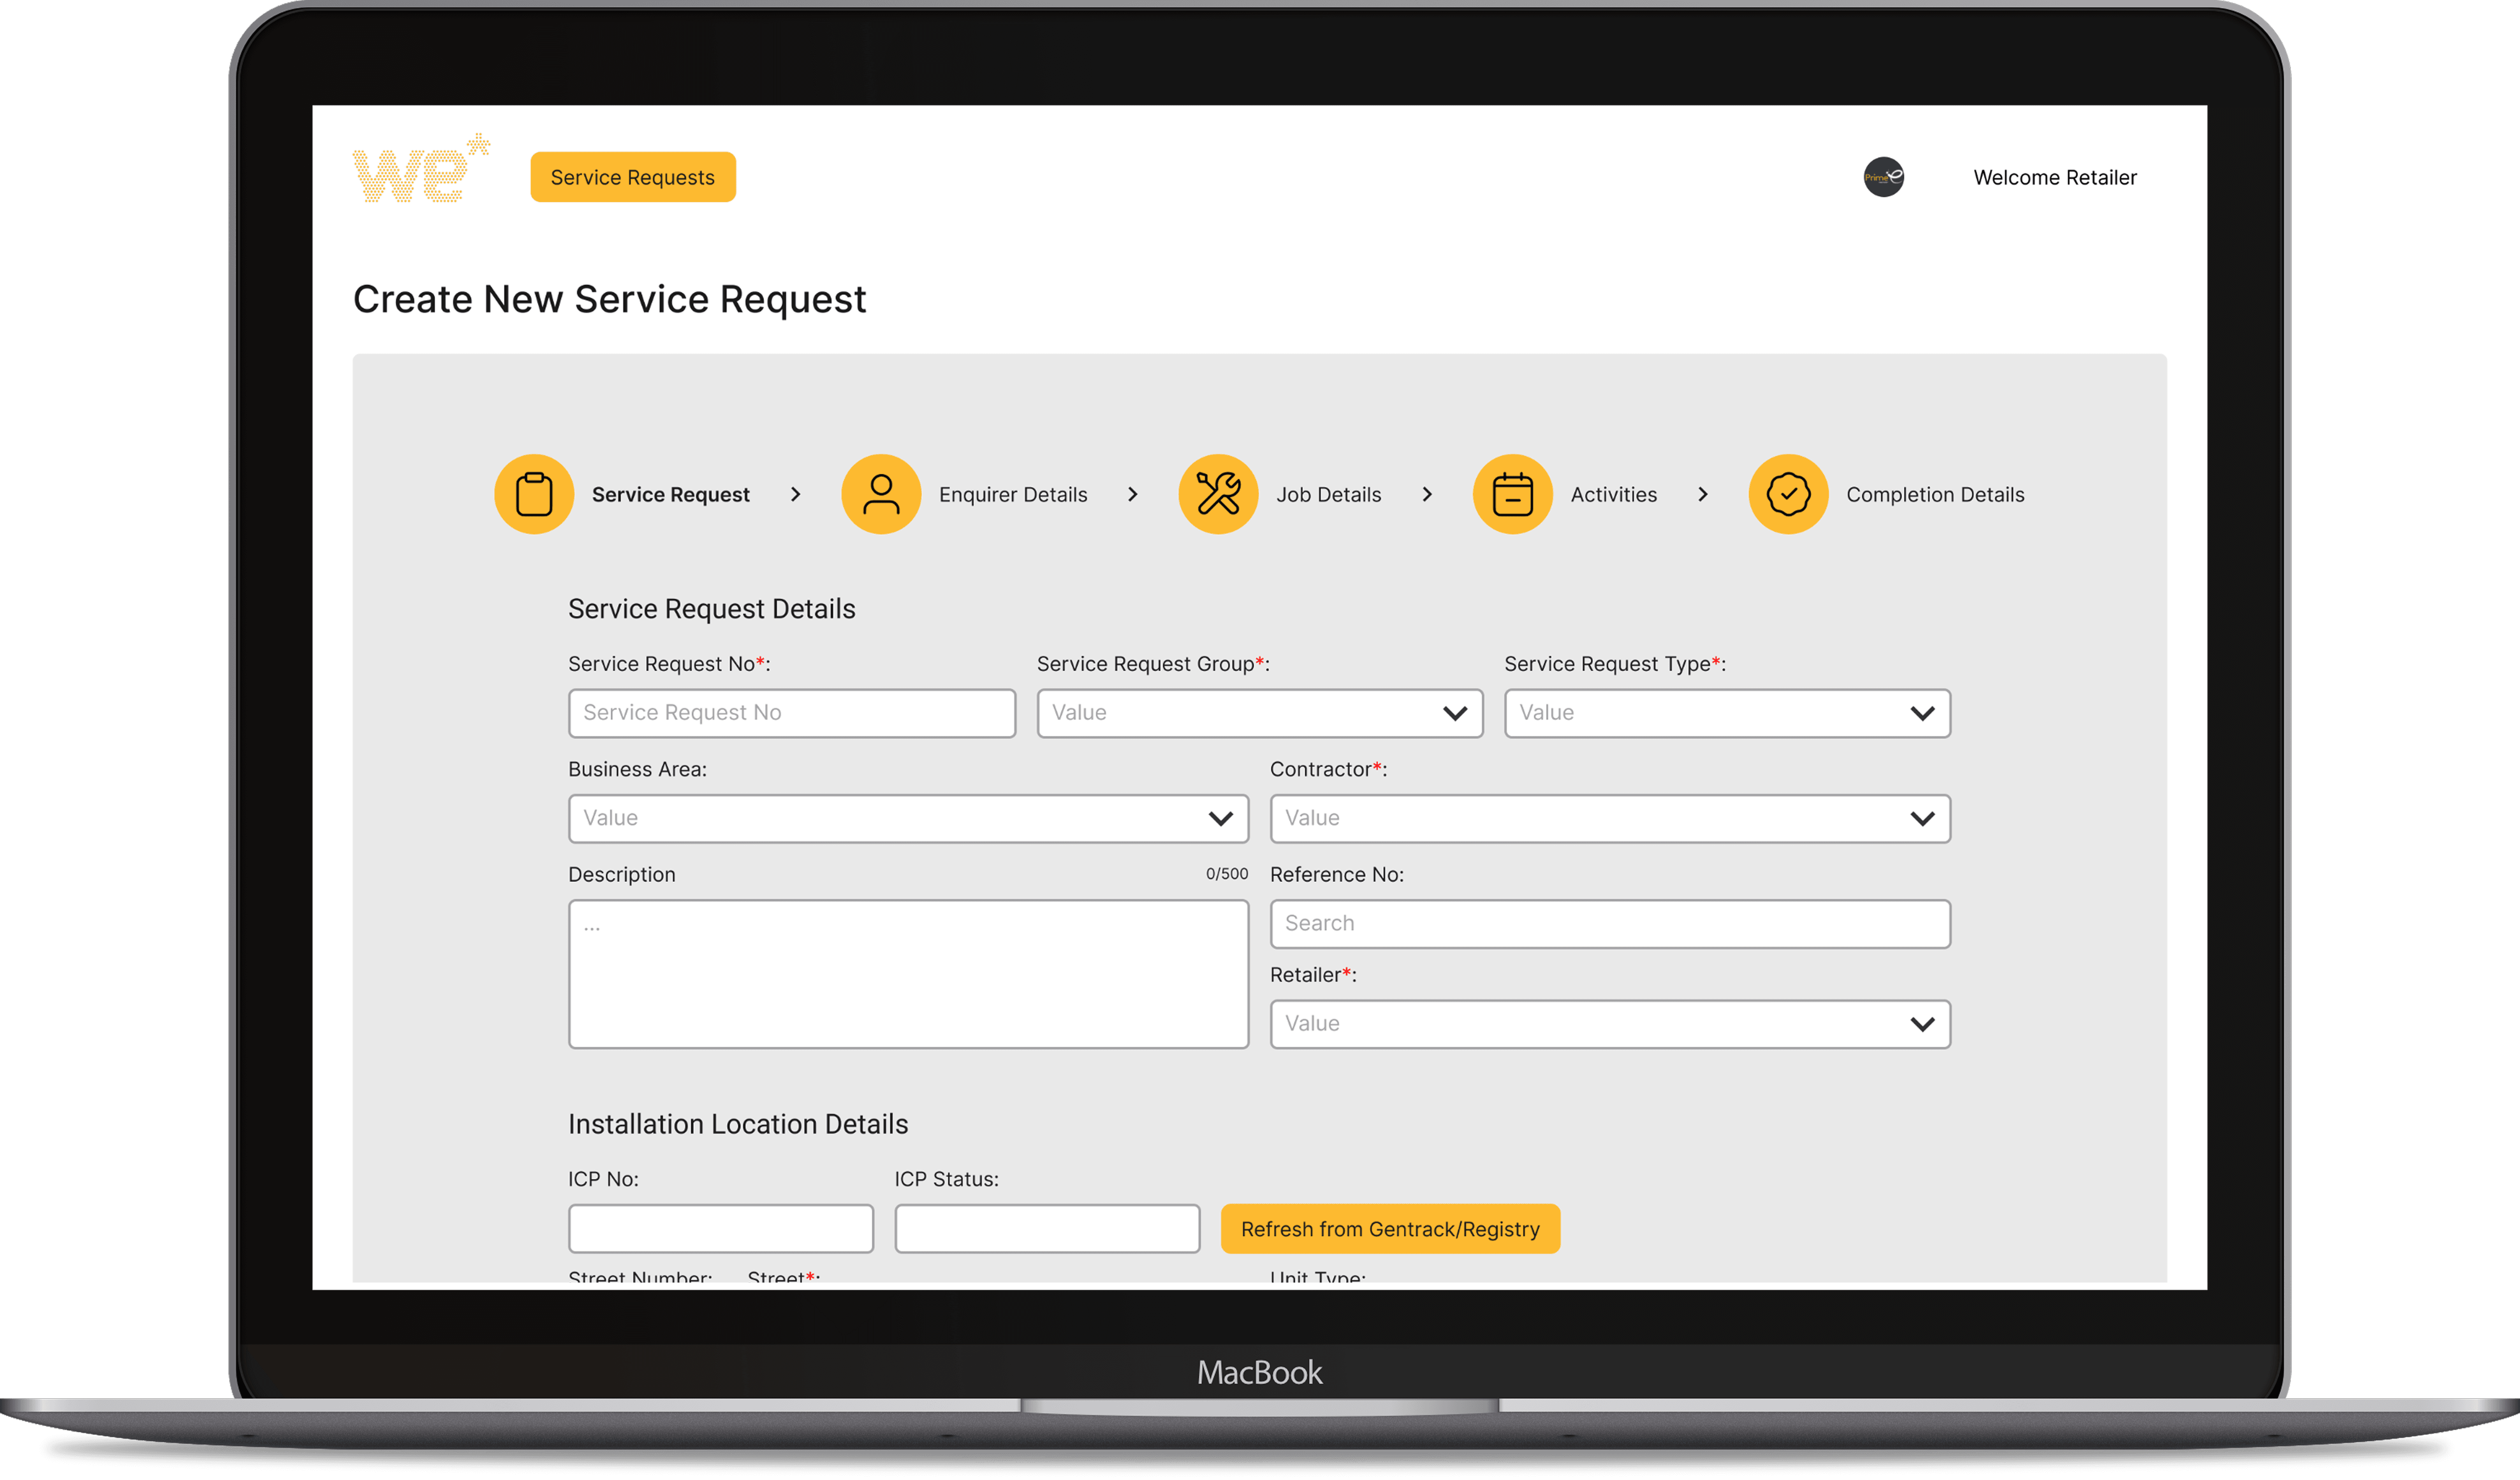
FINAL DESIGN
With a clear understanding of specific use cases, pain points and process maps we were able to draft the final mockups of the portal. I led the design stage of the portal design and the portal was fully developed on Figma. The design also considered that the final portal was to be built on Microsoft PowerPages and was designed accordingly.
MOCKUP
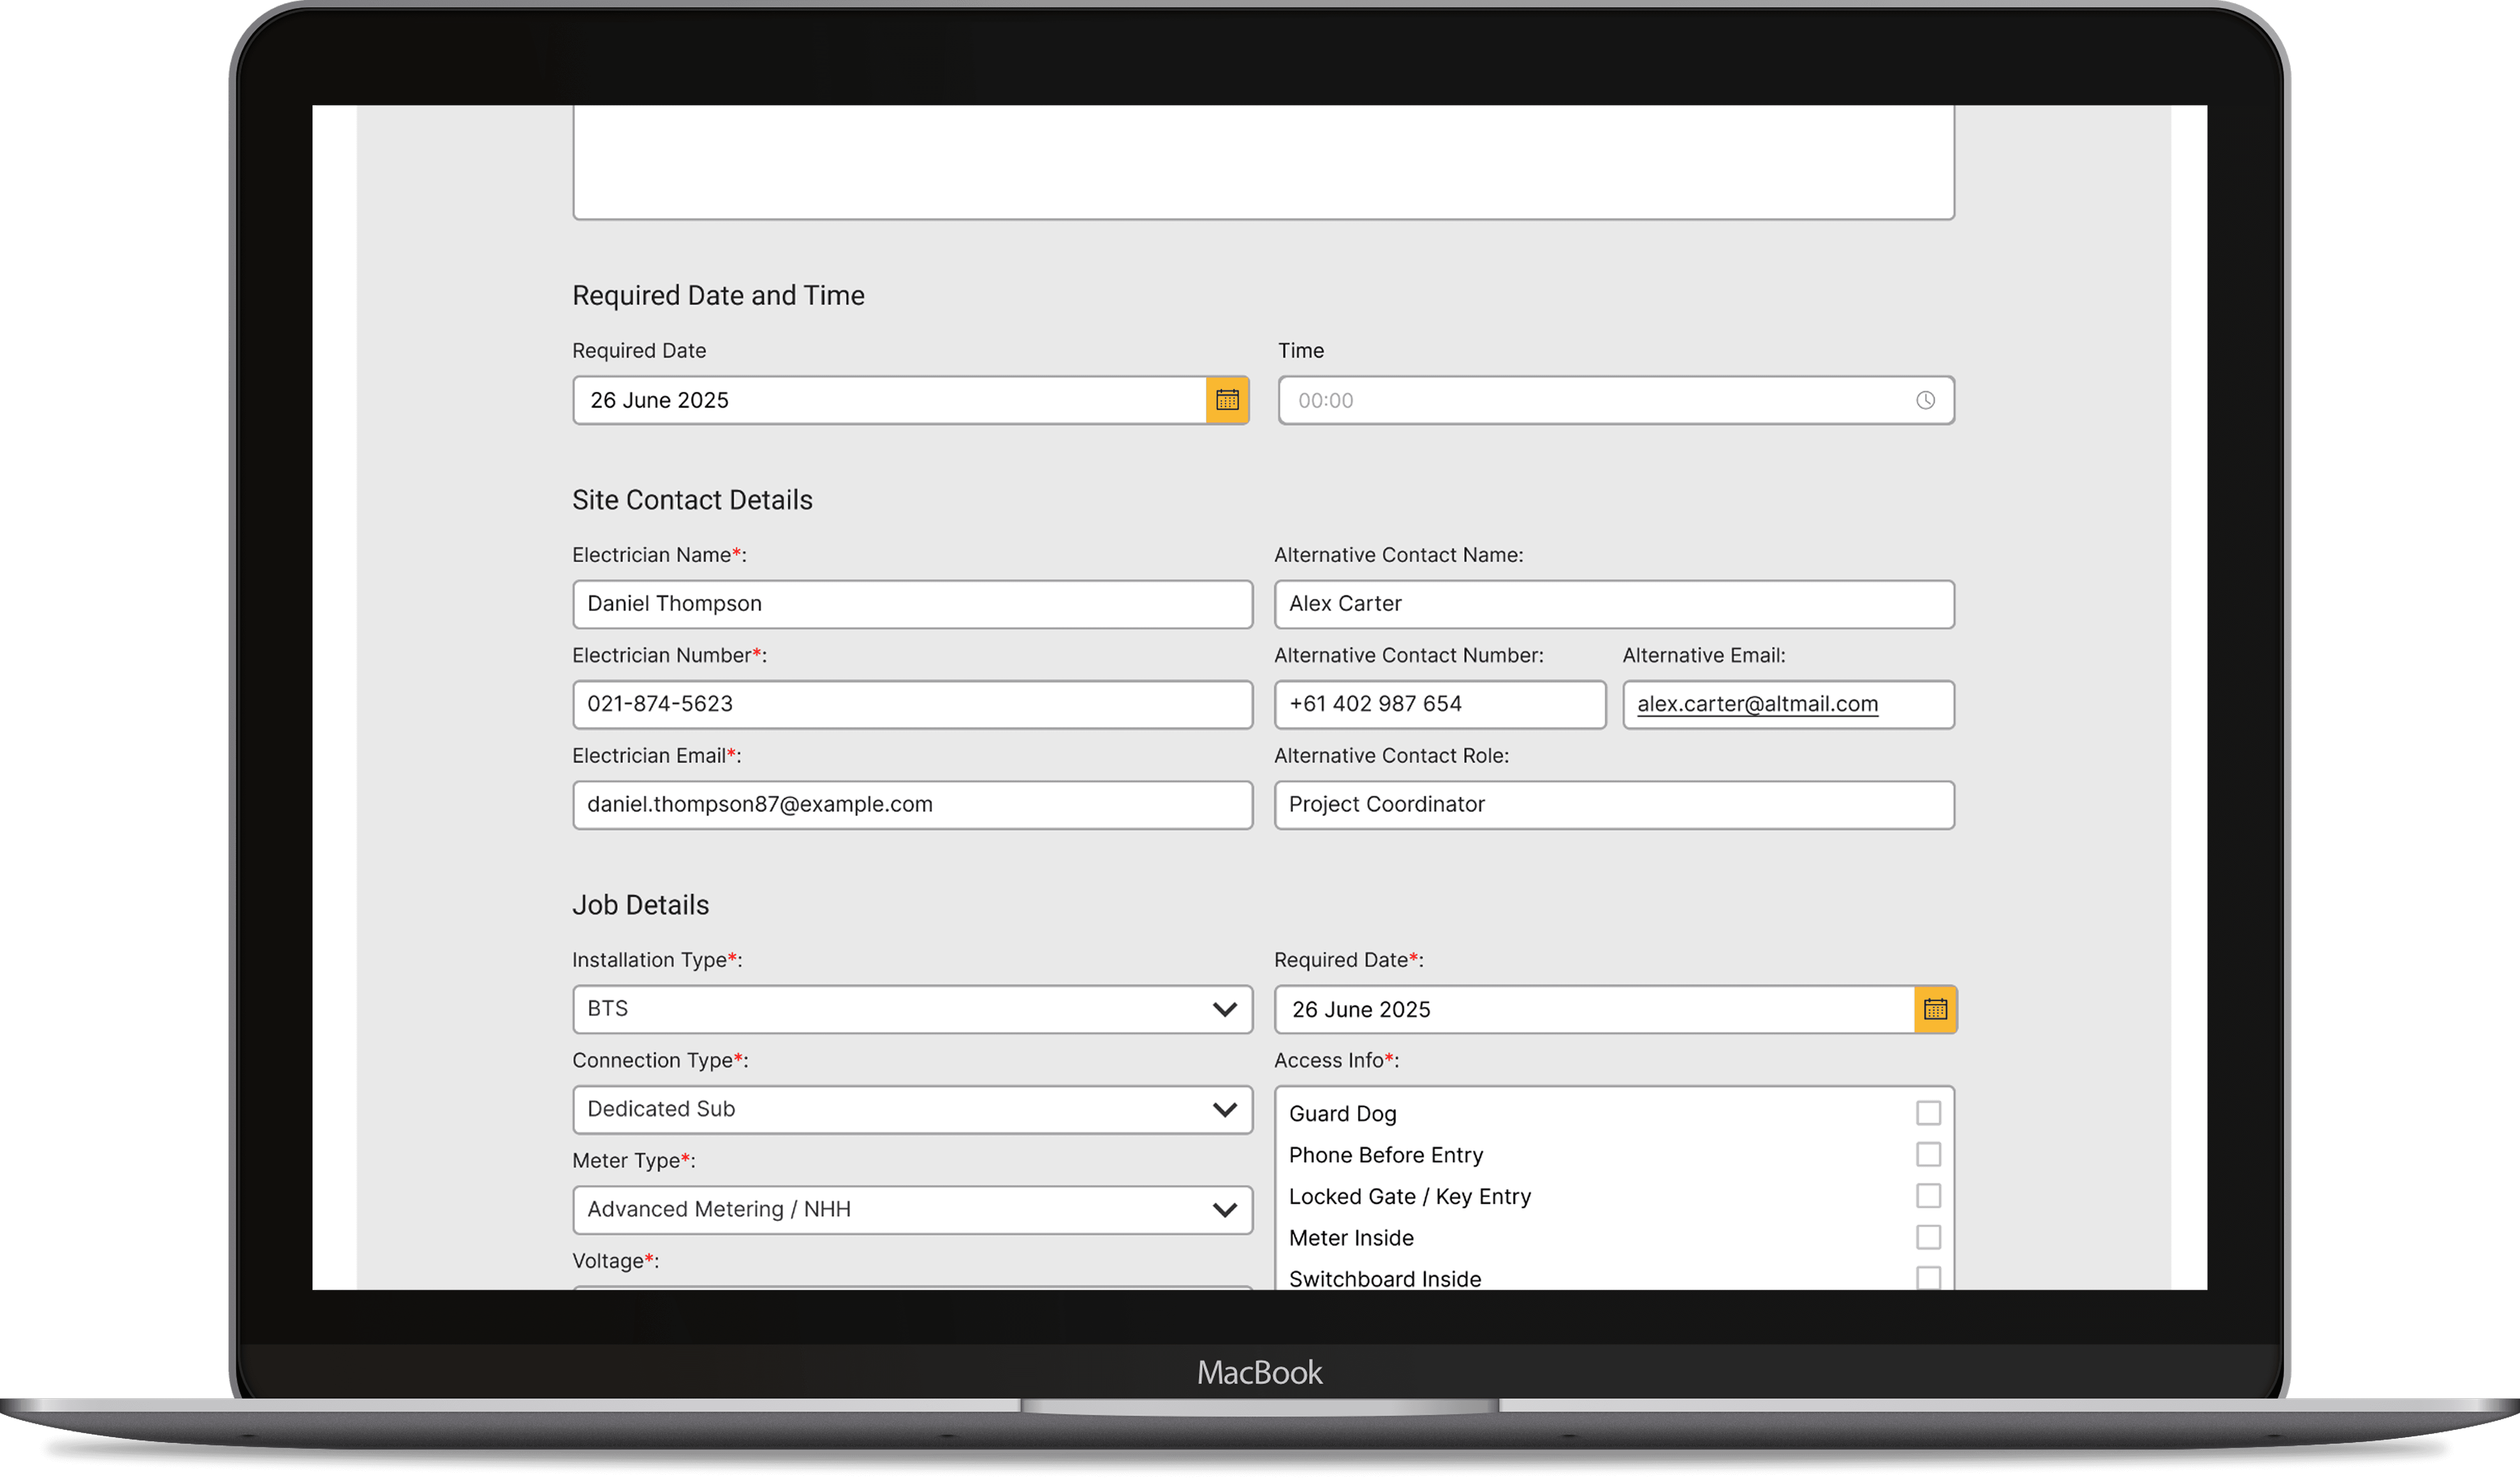
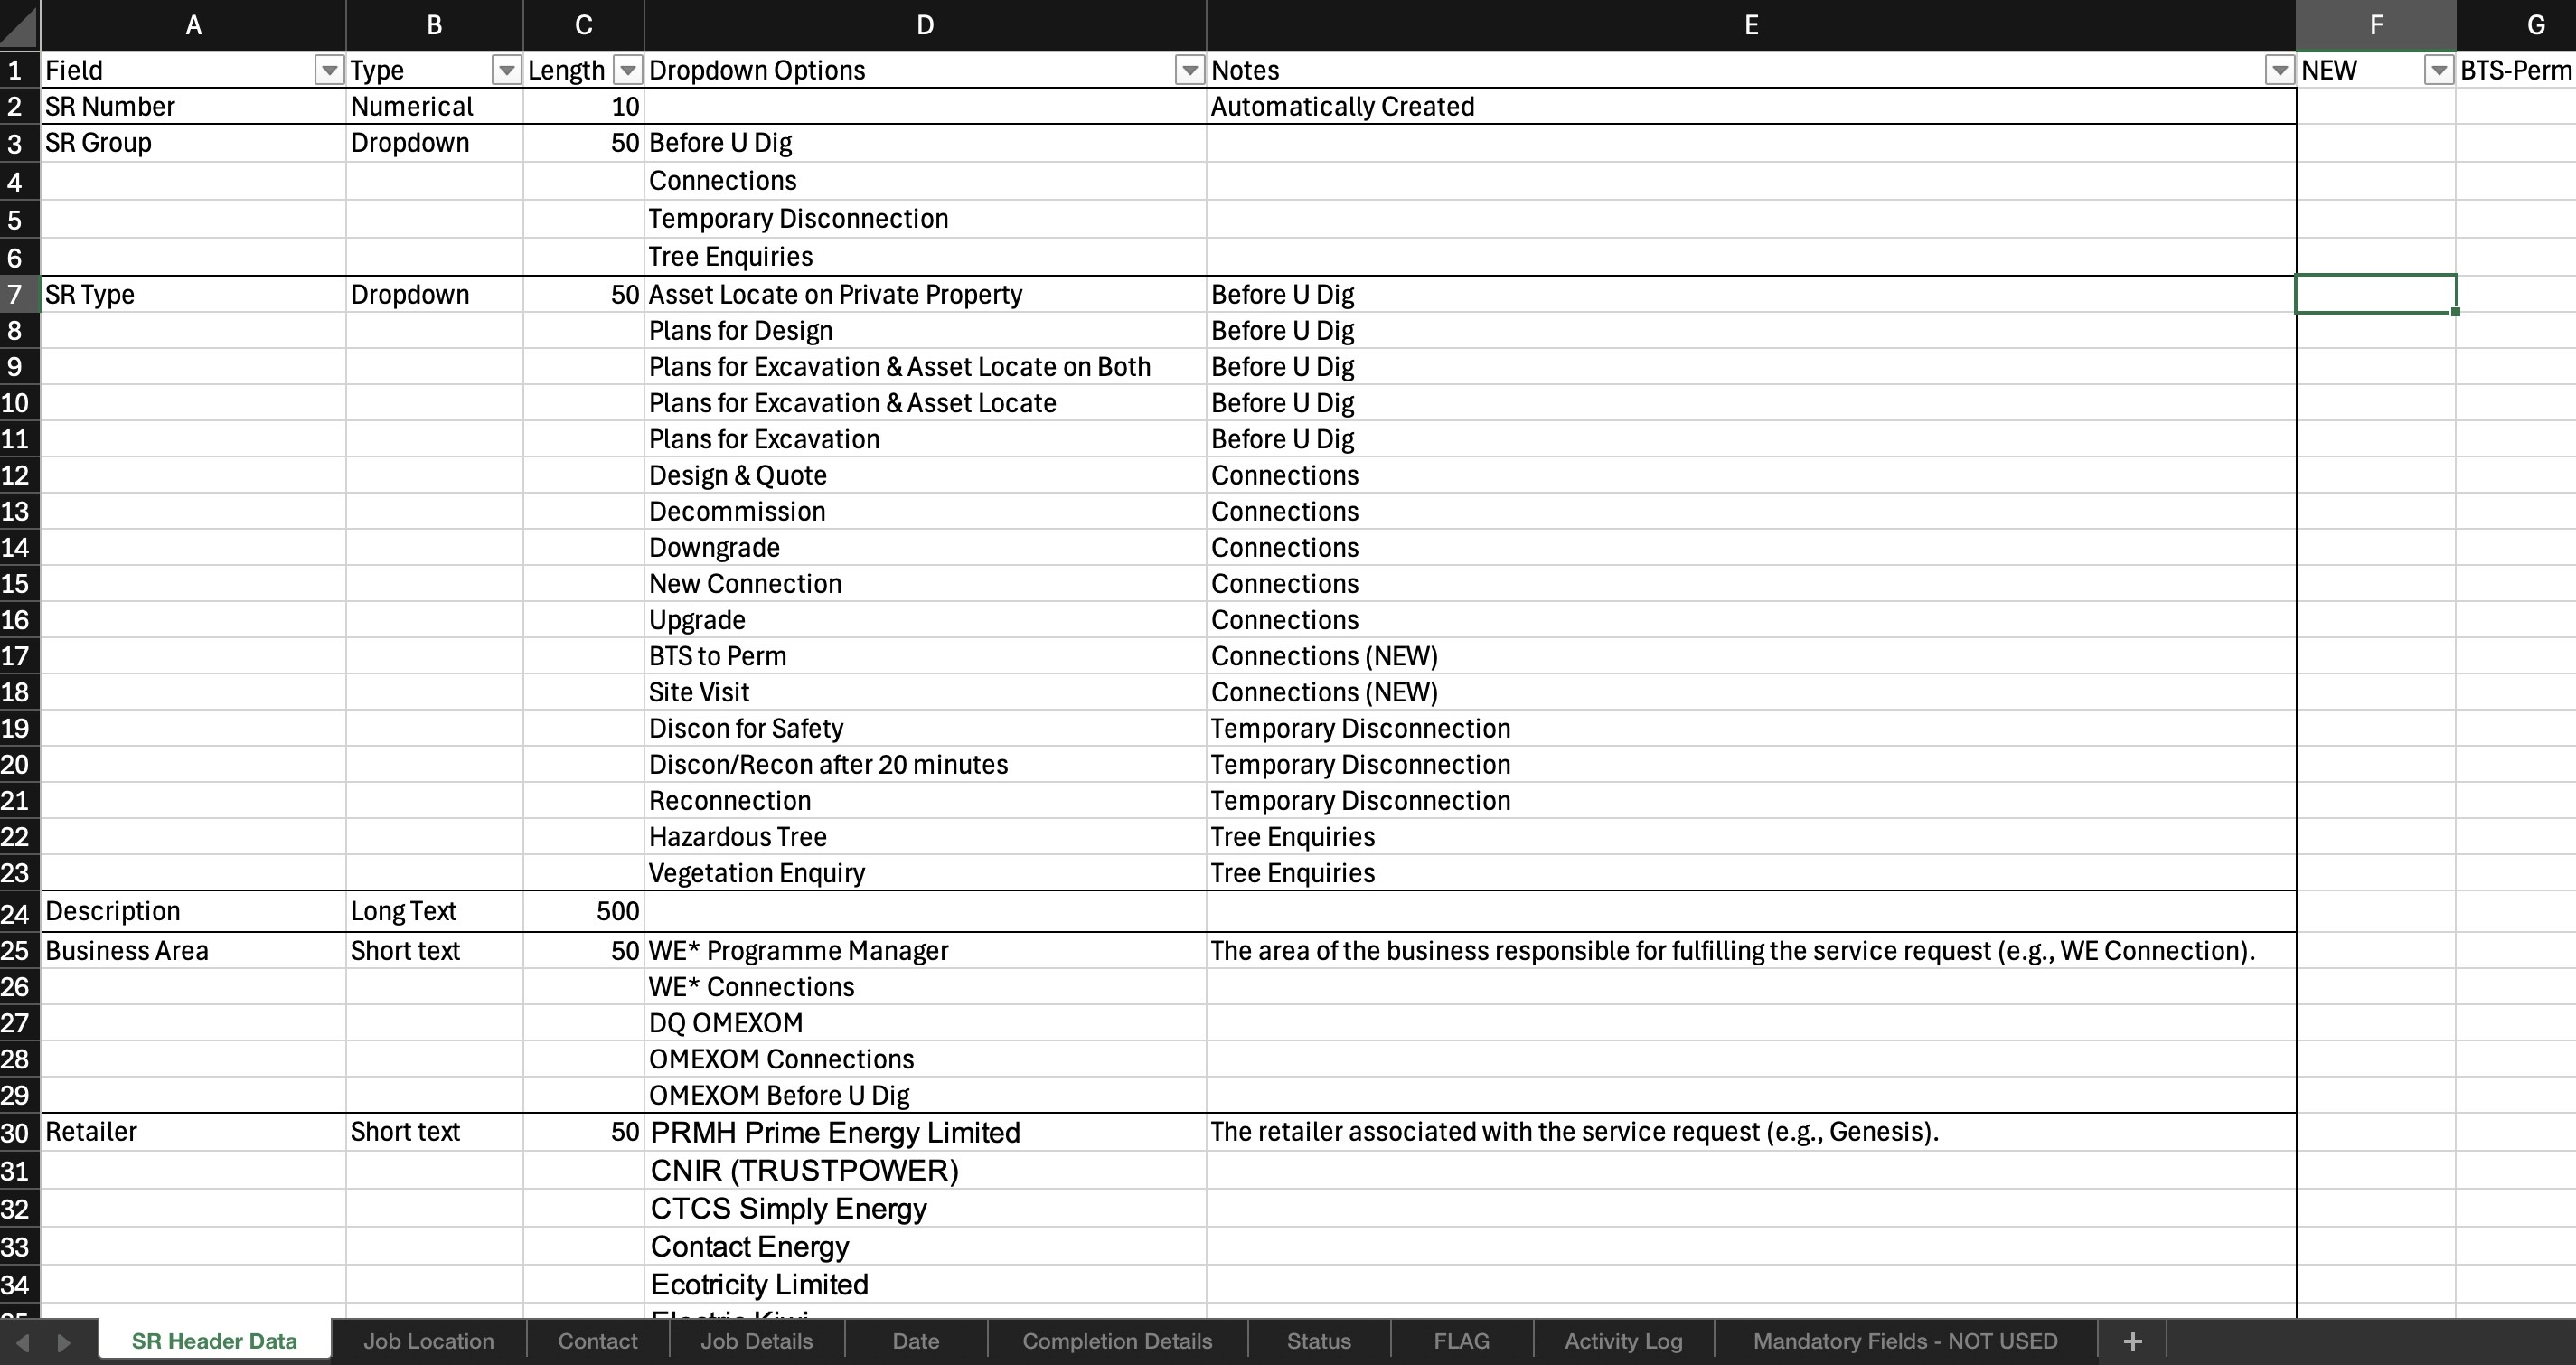
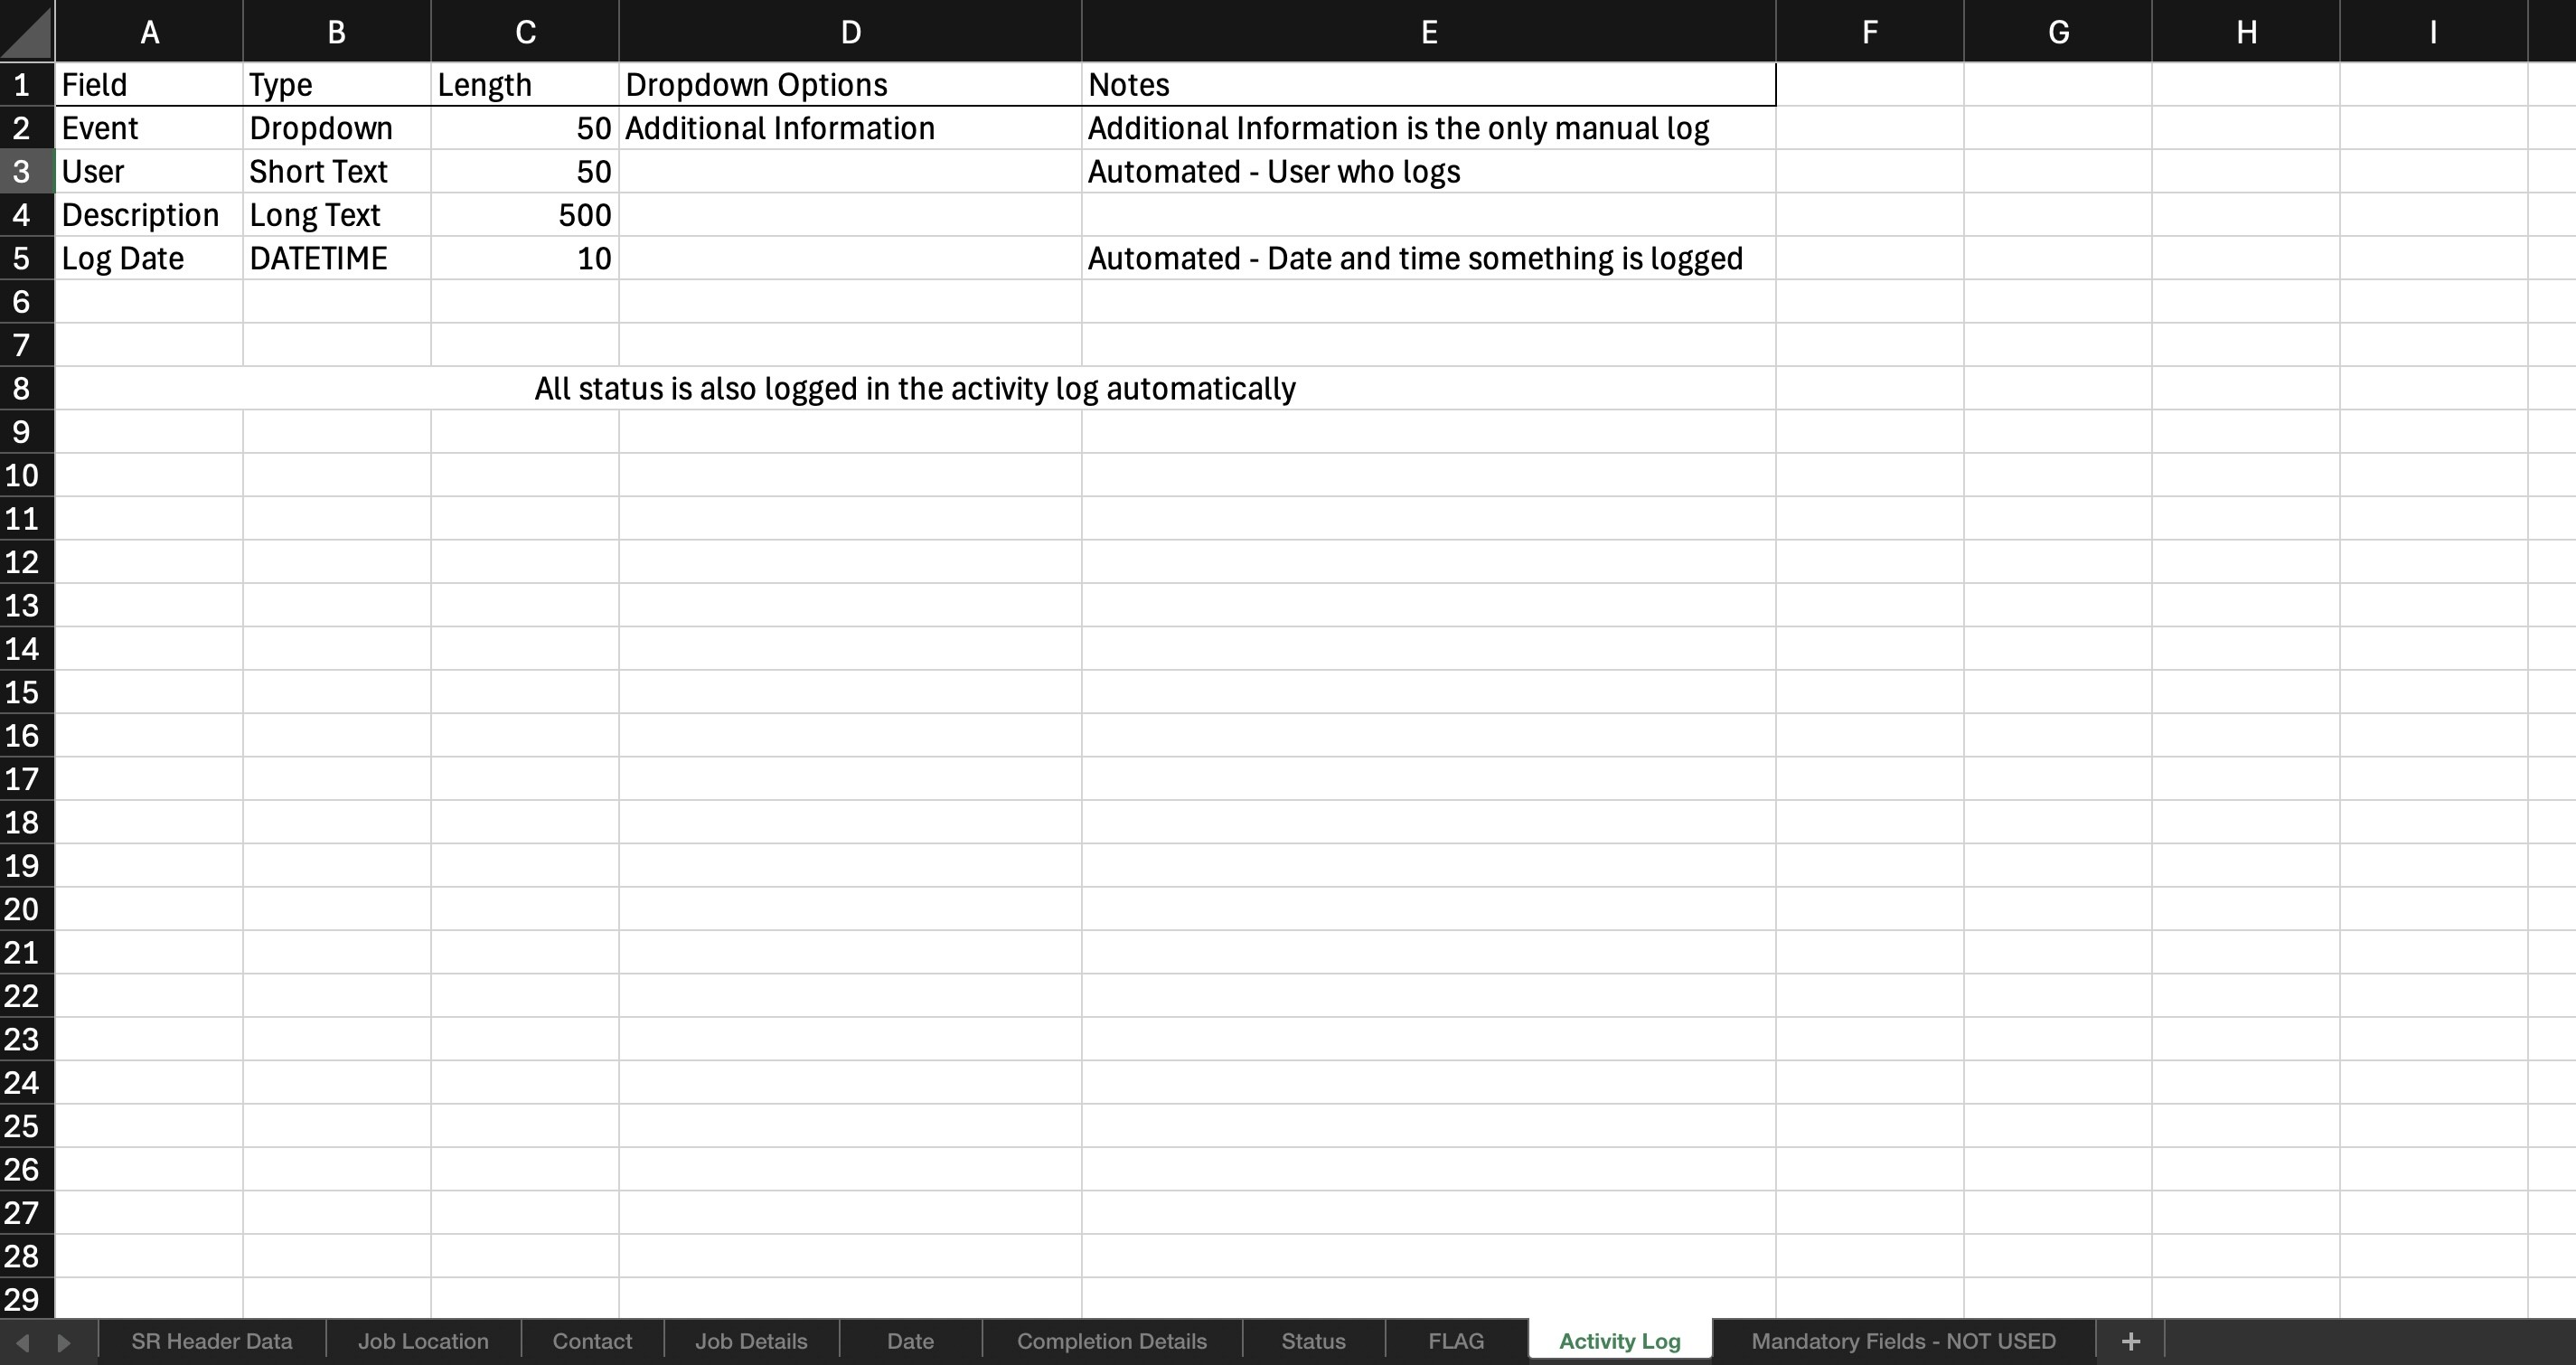
FINAL DATA SCHEMA DESIGN
Based on various user interviews and process walkthroughs we were able to draw up a detailed data schema with specific character limits. The data schema was designed to have the portal host multiple tables. This structure ensured that the portal was scalable in future when large amounts of service requests would need to be saved on the database.
PROTOTYPE WALKTHROUGH
After developing the initial mockups, we conducted a series of prototype walkthroughs with key stakeholders. This included high-volume retailers and key users from Wellington Electricity. These informal sessions helped us gather early impressions and usability insights.
MAIN ISSUES


These UX issues were addressed during development, guided by a UX enhancements table that helped communicate findings to developers and supported ongoing design iterations. At this stage, development was 80% complete. The portal, built on Microsoft PowerPages, was migrated to the client’s development environment, allowing users with organization login IDs to access and test the site before public release.
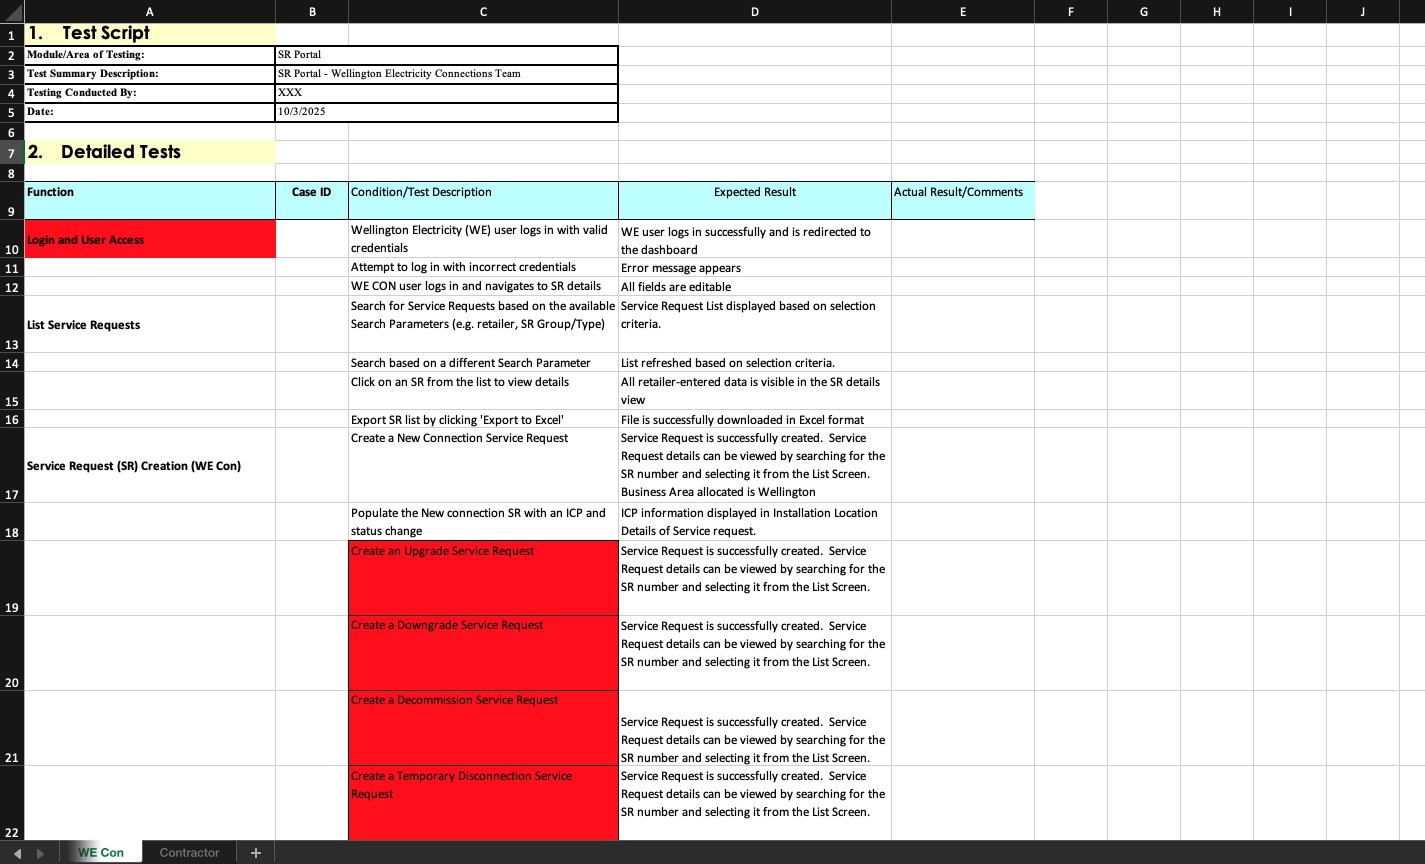
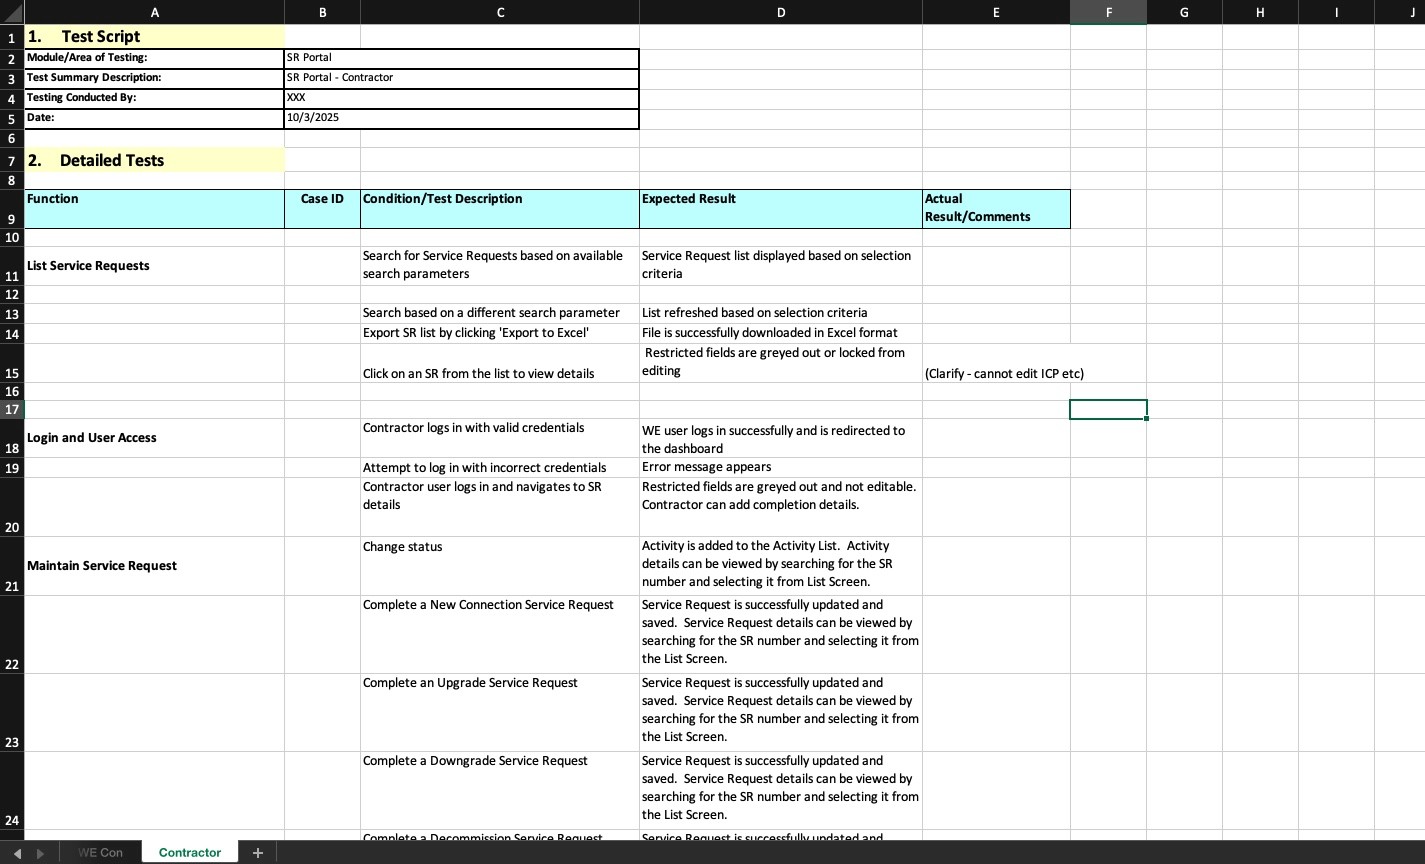
TEST SCRIPTS
With logistics in place, we moved into Unit Testing. I created test scripts covering both happy paths and exception cases to ensure thorough and rigorous testing.
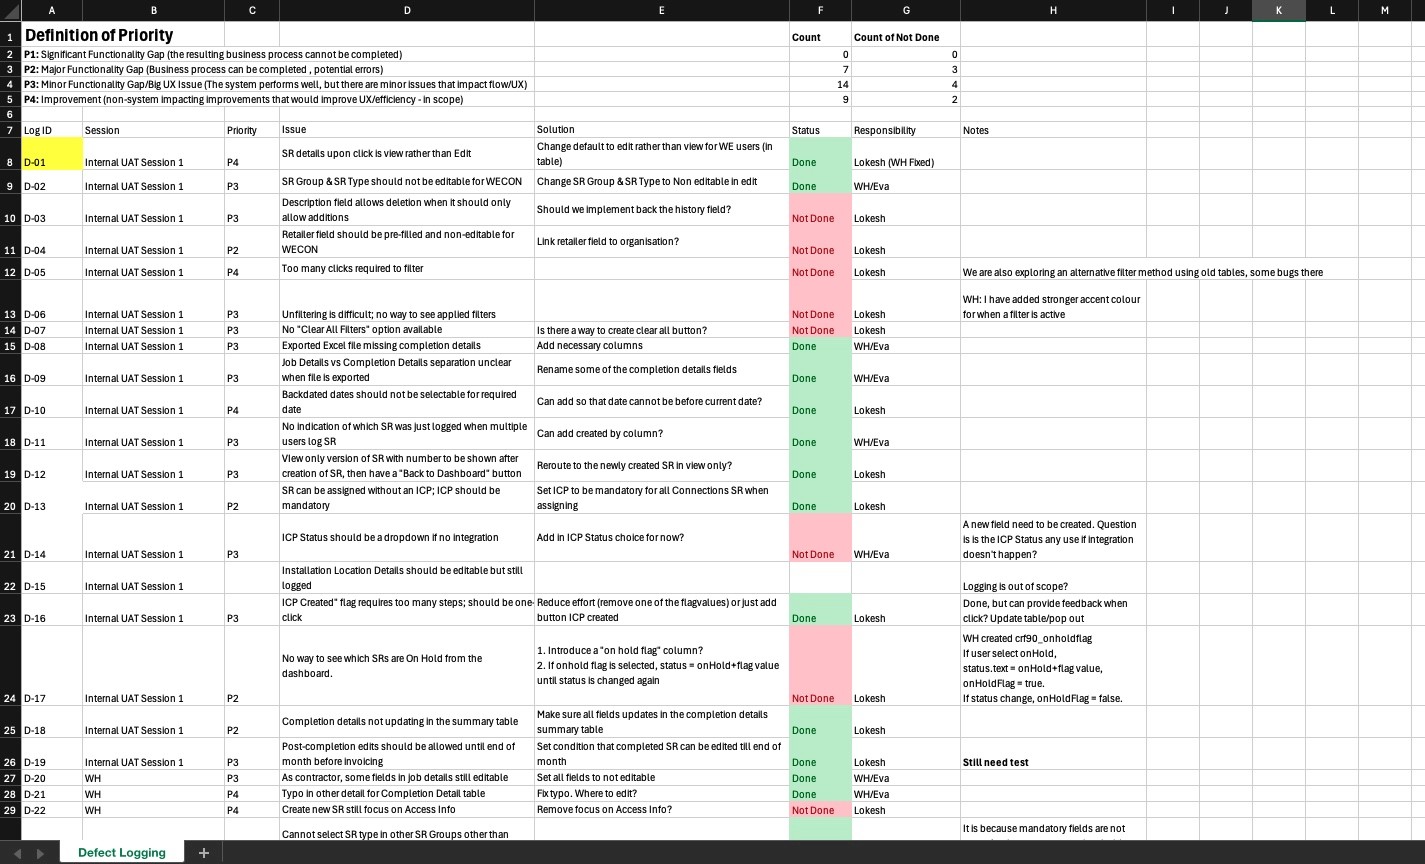
UAT SESSION
Findings during the UAT sessions were recorded and logged in a defects register that was presented to the developer during daily check-ins to fix bugs as we proceeded with testing.
DEFECTS REGISTER
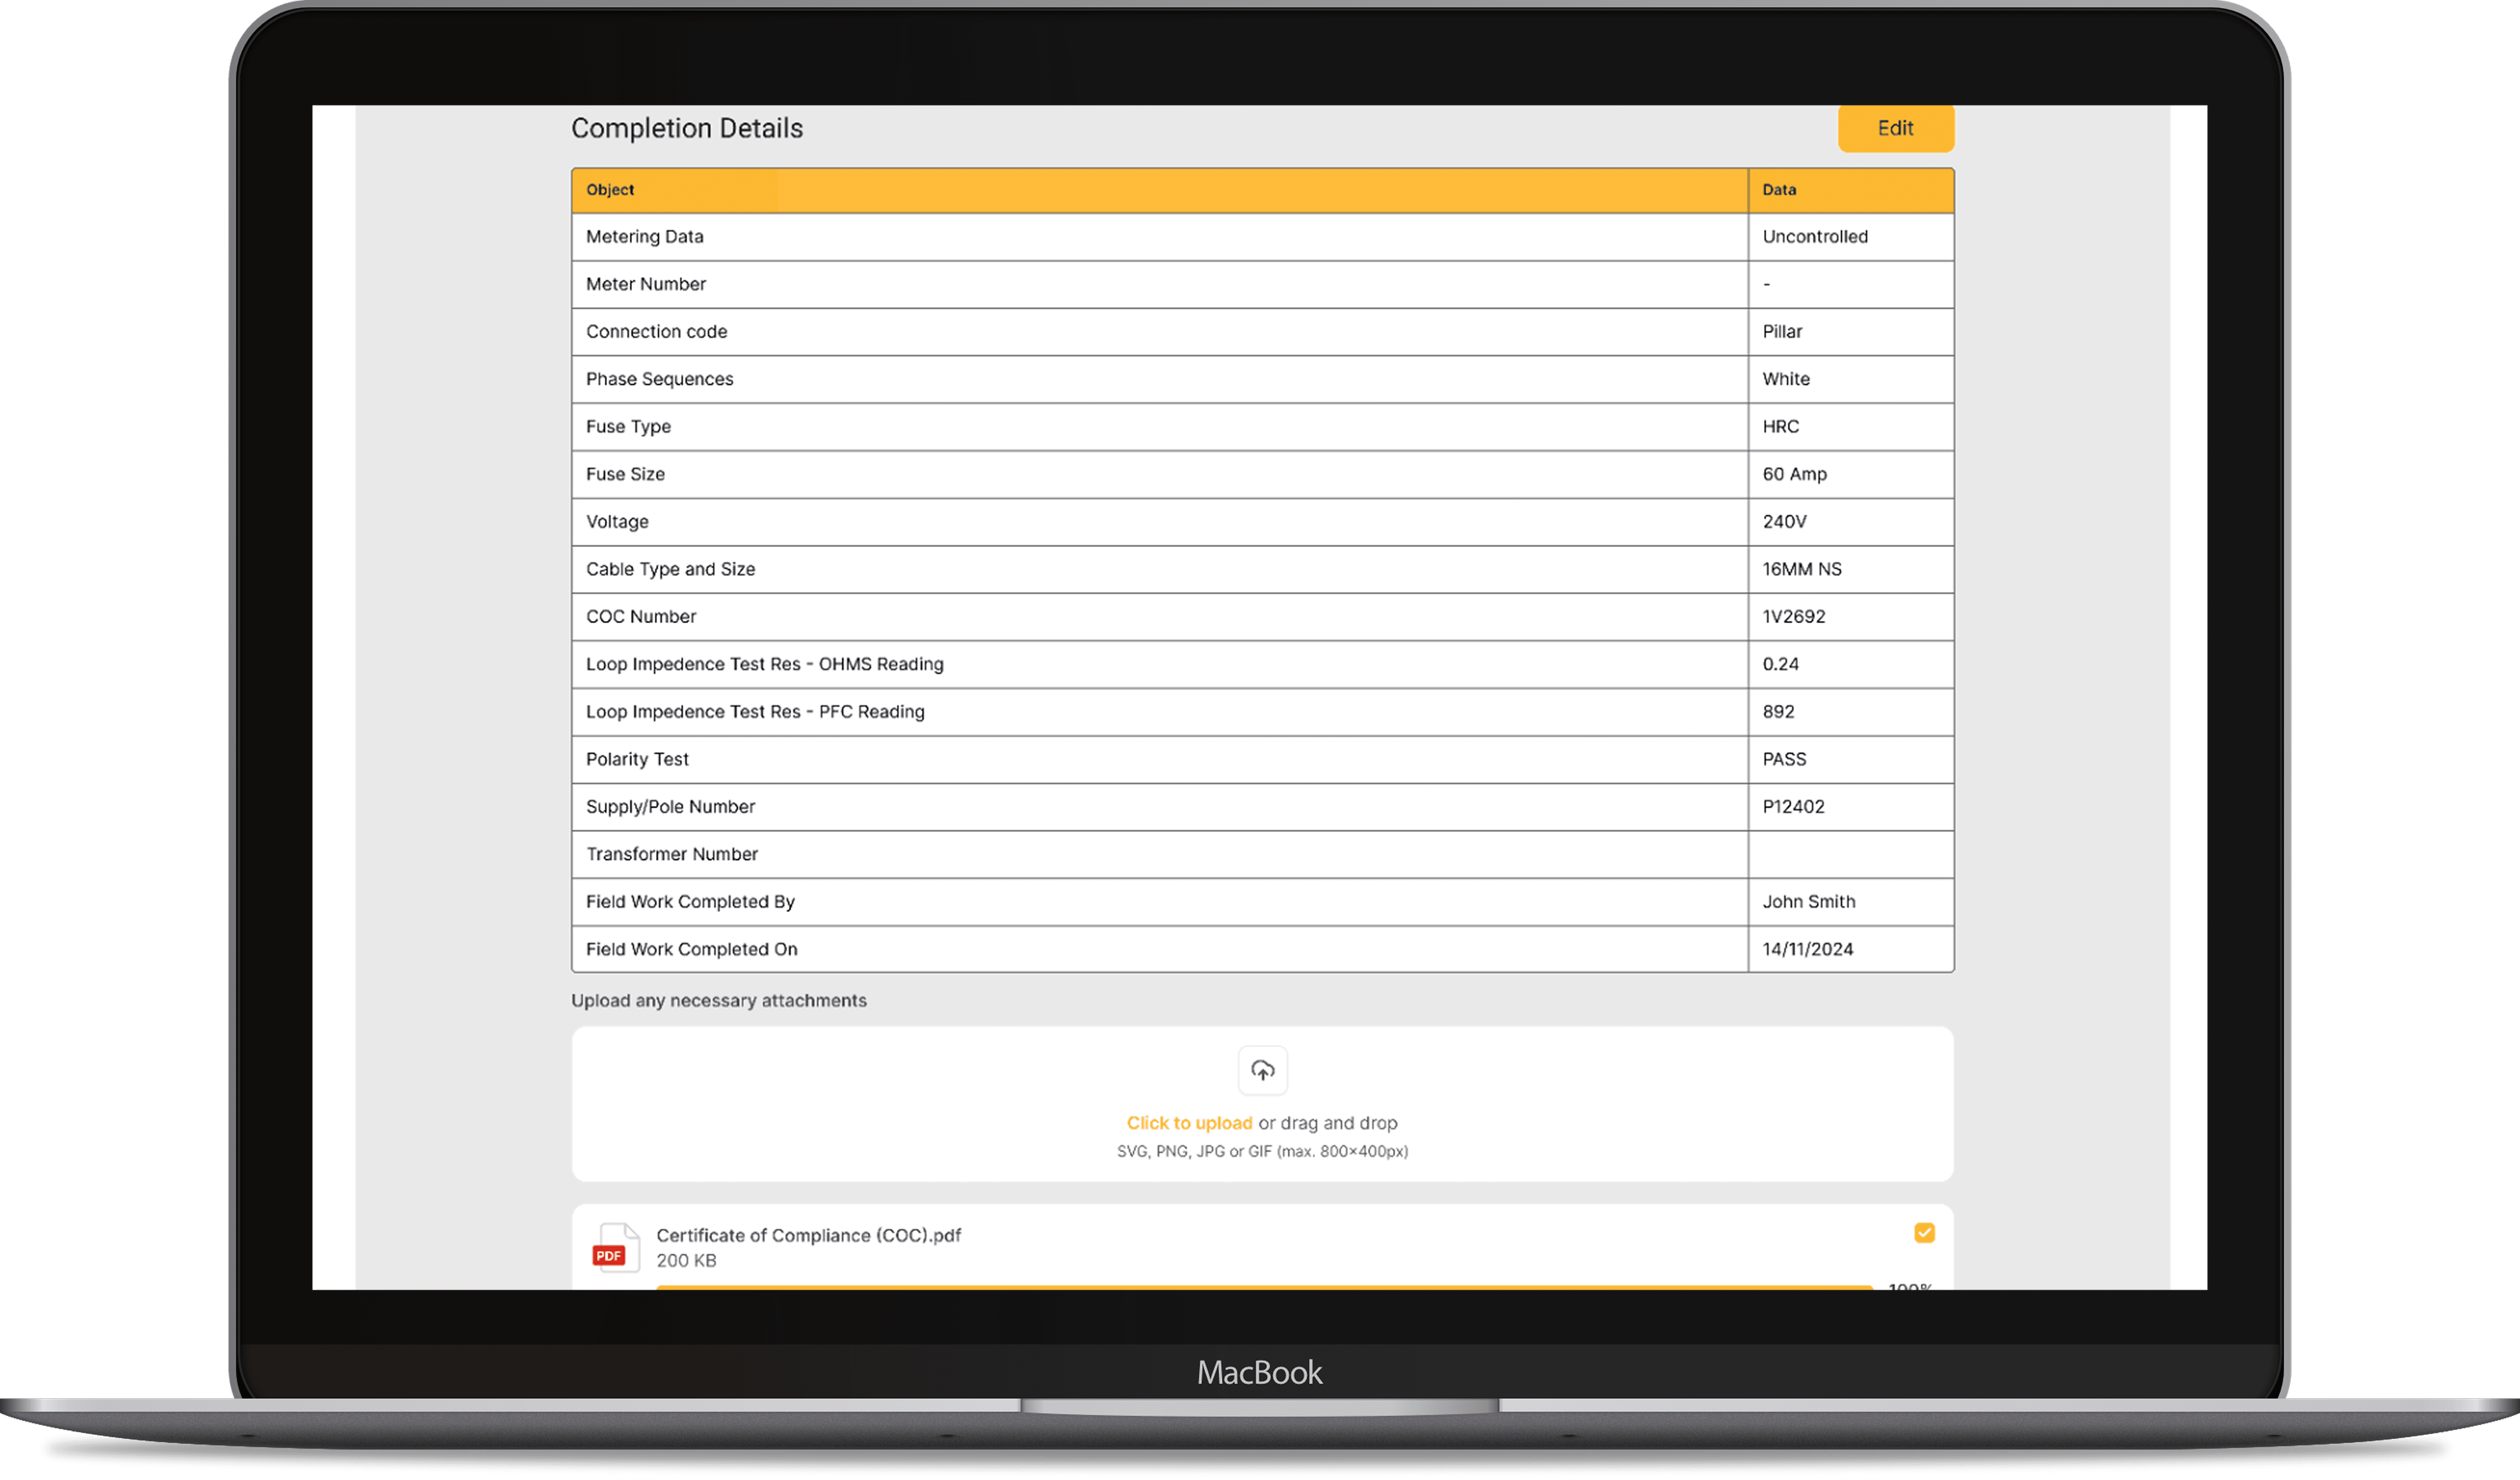
FINAL PRODUCT
Based on testing outcomes, the product was continuously refined in collaboration with the developer. The final version was successfully presented to the client and received positive feedback. With the portal now complete, it was handed over for SAP integration. Training and transition began promptly, marking the close of the project and paving the way for full implementation.